Digital Realty Trust (DLR) closed out FY 2025 with Q4 revenue of US$1.6b and basic EPS of US$0.26, while funds from operations reached US$657.9m, giving investors a clear read on both top line scale and REIT specific cash generation. Over the last few quarters, the company has seen revenue move from US$1.40b in Q4 2024 to US$1.64b in Q3 2025 and then to US$1.64b in Q4 2025, with basic EPS ranging from US$0.54 in Q4 2024 to US$0.17 in Q3 2025 and US$0.26 in Q4 2025. With trailing twelve month net margin at 20.9% versus 10.3% a year earlier and a sizeable one off gain in the mix, investors are likely to focus on how much of this profitability picture stems from recurring operations versus exceptional items.
See our full analysis for Digital Realty Trust.
With the headline numbers on the table, the next step is to see how this latest print lines up against the widely followed narratives around Digital Realty Trust’s growth, profitability and risk profile, and where those stories may need updating.
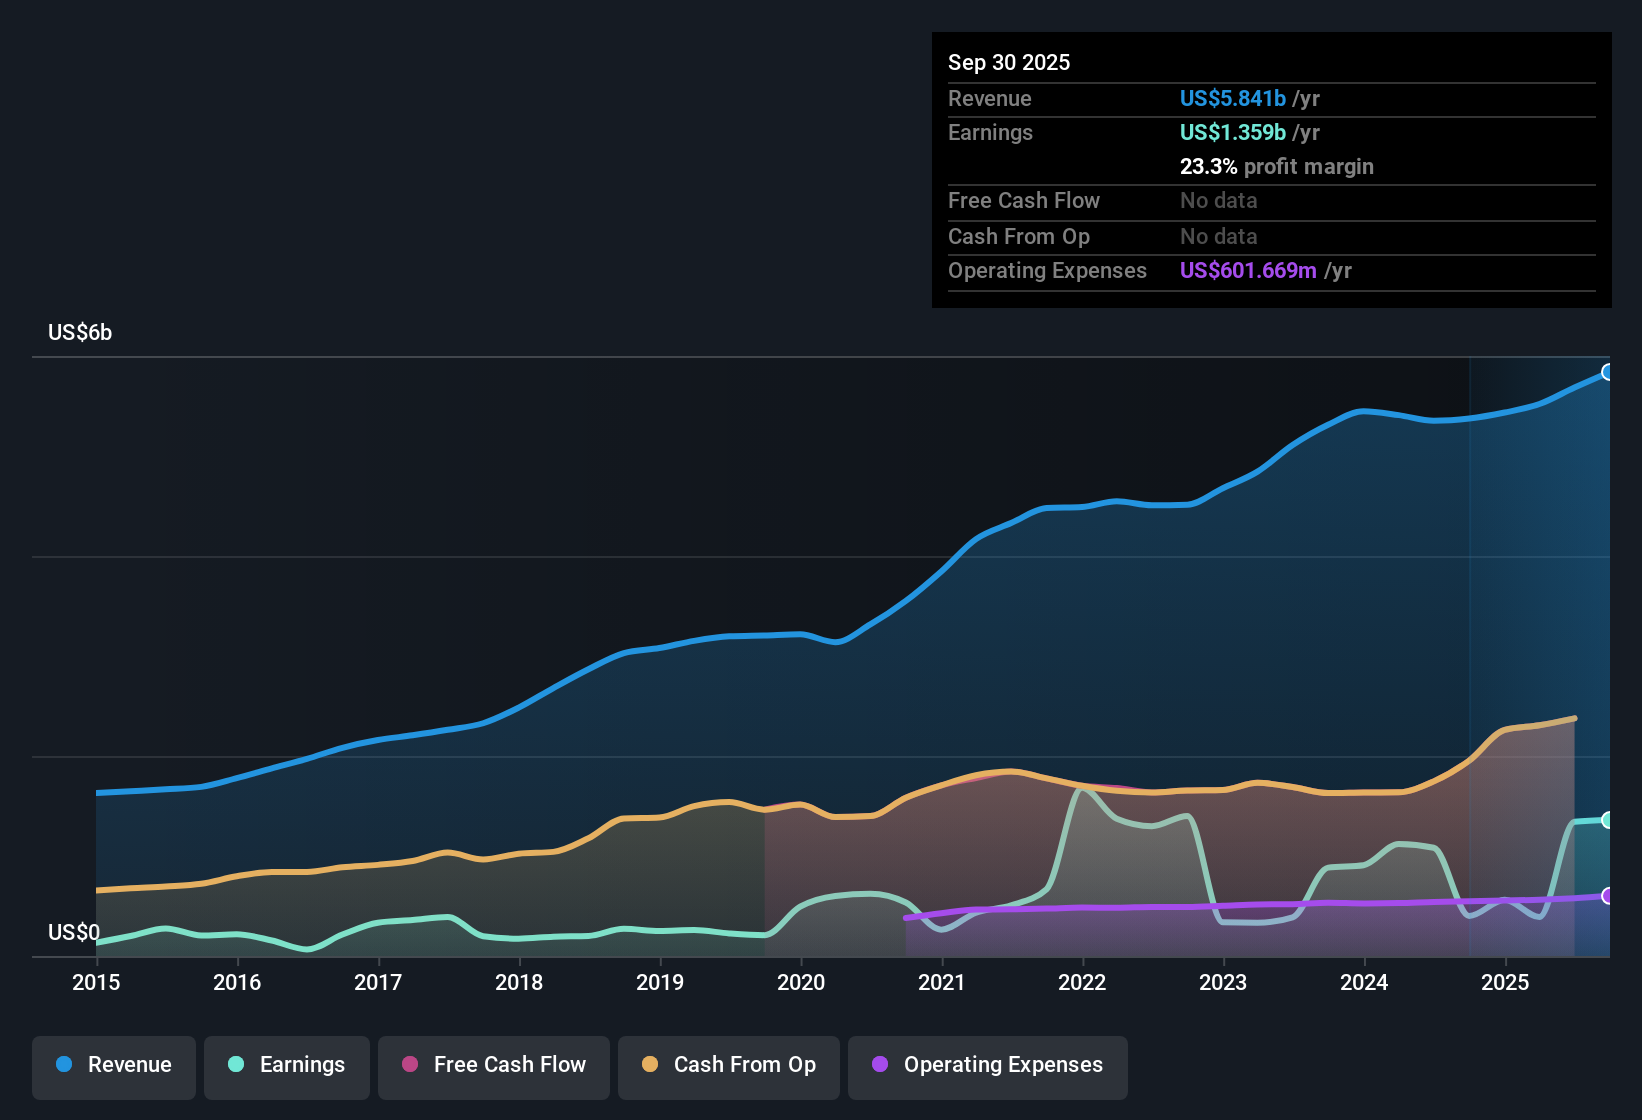
NYSE:DLR Earnings & Revenue History as at Feb 2026
FFO Holds Steady Around US$1.7 Per Share
Across FY 2025, FFO per share ranged from US$1.64 to US$1.88, with Q4 at US$1.88 and the trailing twelve month figure at US$6.94. This keeps the REIT cash flow story centered on FFO rather than basic EPS swings.
What stands out for the bullish view is that FFO per share is relatively clustered quarter to quarter, even as basic EPS moved between US$0.17 and US$3.03. This heavily supports the idea that the core real estate cash generation is more stable than reported earnings.
Bulls often argue data center REITs benefit from mission critical demand and long leases, and the TTM FFO of about US$2.4b against US$6.1b of revenue gives some backing to that focus on recurring cash flow.
At the same time, critics of the bullish case can point out that FFO per share growth is not broken out here, so investors still need to judge for themselves how much of that US$6.94 per share feels durable.
Margins Lifted To 20.9% By One Off Gain
Trailing twelve month net margin sits at 20.9% versus 10.3% a year earlier, helped by a very large US$720.5m one off gain that pushed TTM net income to about US$1.3b on US$6.1b of revenue.
Bears focus on that one off gain as a key risk, and the numbers here give them clear ammunition because the 125.7% earnings growth over the last year is not matched by similar revenue growth of 8.9%.
Skeptics highlight that once you strip out the US$720.5m gain, the margin picture looks much less dramatic. This challenges any bearish claim that the business relies on outsized deals every year.
On the other hand, the same figures challenge a simple bullish read on earnings momentum because the jump in profitability is not purely from underlying operations.
Over the last year’s strong reported earnings, many investors are asking whether this is a new normal or a one off spike, and the detailed bear case tries to answer that question in depth.
🐻 Digital Realty Trust Bear Case
Mixed Signals At 46.5x P/E And 20.9% Margin
The trailing P/E of 46.5x screens as expensive versus the Specialized REITs industry average of 26x. At the same time, the company’s net margin of 20.9% and 7% five year average earnings growth are part of the reason the stock does not look out of line with some higher growth peers on 78.1x.
What is interesting for the bullish camp is that the stock trades below the DCF fair value of US$219.98 while still carrying a higher P/E than the industry. This creates tension between a model that flags upside and market pricing that already reflects richer multiples.
Supporters of the bullish case can point to the roughly 22% gap between the current US$171.62 share price and the DCF fair value, especially when combined with the 2.84% dividend yield.
Critics of that bullish stance counter that the high P/E and balance sheet risk flagged by weak debt coverage from operating cash flow mean investors are paying up for a business where leverage remains a key watchpoint.
If you want to see how different investors weigh that high P/E against the DCF fair value and cash flow risks, the broader community narratives give a helpful cross check on today’s numbers.
Curious how numbers become stories that shape markets? Explore Community Narratives
Next Steps
Don't just look at this quarter; the real story is in the long-term trend. We've done an in-depth analysis on Digital Realty Trust's growth and its valuation to see if today's price is a bargain. Add the company to your watchlist or portfolio now so you don't miss the next big move.
Explore Alternatives
The combination of a 46.5x P/E, a large one off gain driving a 20.9% margin, and flagged balance sheet risk suggests that earnings quality and financial strength are key concerns.
If you want ideas where debt and cash coverage look tighter, check out our solid balance sheet and fundamentals stocks screener (45 results) to quickly shortlist companies that might better match your risk comfort.
This article by Simply Wall St is general in nature. We provide commentary based on historical data and analyst forecasts only using an unbiased methodology and our articles are not intended to be financial advice. It does not constitute a recommendation to buy or sell any stock, and does not take account of your objectives, or your financial situation. We aim to bring you long-term focused analysis driven by fundamental data. Note that our analysis may not factor in the latest price-sensitive company announcements or qualitative material. Simply Wall St has no position in any stocks mentioned.