Dutch Bros Full Year 2024 Earnings: Beats Expectations
Dutch Bros BROS | 0.00 |
Dutch Bros (NYSE:BROS) Full Year 2024 Results
Key Financial Results
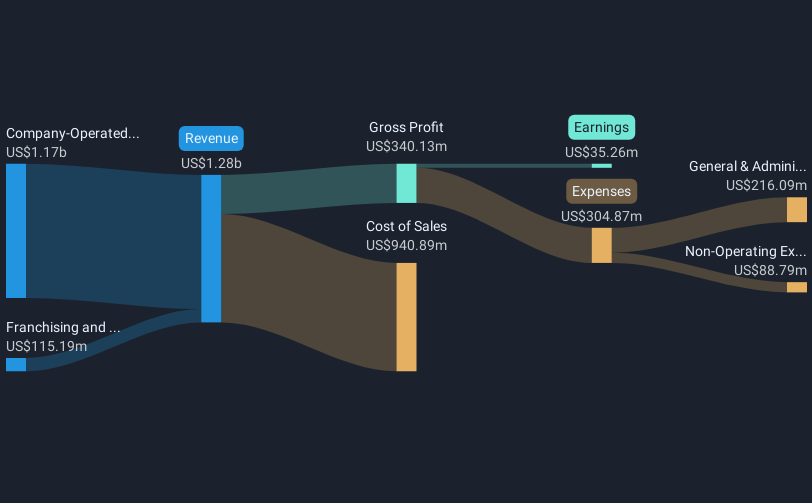
- Revenue: US$1.28b (up 33% from FY 2023).
- Net income: US$35.3m (up by US$33.5m from FY 2023).
- Profit margin: 2.8% (up from 0.2% in FY 2023). The increase in margin was driven by higher revenue.
- EPS: US$0.34 (up from US$0.028 in FY 2023).
BROS Sales Performance and Store Count
- Same store sales growth: 5.3% vs FY 2023.
- Total stores: 982 (up by 151 from FY 2023).
All figures shown in the chart above are for the trailing 12 month (TTM) period
Dutch Bros Revenues and Earnings Beat Expectations
Revenue exceeded analyst estimates by 1.9%. Earnings per share (EPS) also surpassed analyst estimates by 1.3%.
The primary driver behind last 12 months revenue was the Company-Operated Shops segment contributing a total revenue of US$1.17b (91% of total revenue). Notably, cost of sales worth US$940.9m amounted to 73% of total revenue thereby underscoring the impact on earnings. The largest operating expense was General & Administrative costs, amounting to US$216.1m (71% of total expenses). Explore how BROS's revenue and expenses shape its earnings.
Looking ahead, revenue is forecast to grow 16% p.a. on average during the next 3 years, compared to a 9.9% growth forecast for the Hospitality industry in the US.
The company's shares are up 33% from a week ago.
Balance Sheet Analysis
While it's very important to consider the profit and loss statement, you can also learn a lot about a company by looking at its balance sheet. We have a graphic representation of Dutch Bros' balance sheet and an in-depth analysis of the company's financial position.
This article by Simply Wall St is general in nature. We provide commentary based on historical data and analyst forecasts only using an unbiased methodology and our articles are not intended to be financial advice. It does not constitute a recommendation to buy or sell any stock, and does not take account of your objectives, or your financial situation. We aim to bring you long-term focused analysis driven by fundamental data. Note that our analysis may not factor in the latest price-sensitive company announcements or qualitative material. Simply Wall St has no position in any stocks mentioned.