
Please use a PC Browser to access Register-Tadawul
Get It
Dycom Industries Multi Year Growth Strengthens Case For Current Valuation
Dycom Industries, Inc. DY | 429.73 | +2.46% |
Dycom Industries, a key contractor for telecom and broadband infrastructure, operates at the center of ongoing network buildouts and upgrades. As carriers invest in fiber, wireless and related projects, Dycom’s multi-year progress across revenue, operating margins and earnings per share highlights how its business model is connecting with this demand. For you as an investor, it focuses attention on the company’s execution rather than short term headlines.
The consistency of these financial trends may prompt you to look more closely at how Dycom is positioned with major customers and contract pipelines. While past performance does not predict what happens next, the combination of profitability gains and business traction can be useful inputs as you think about risk, capital allocation and where NYSE:DY might fit in a diversified portfolio.
Stay updated on the most important news stories for Dycom Industries by adding it to your watchlist or portfolio. Alternatively, explore our Community to discover new perspectives on Dycom Industries.
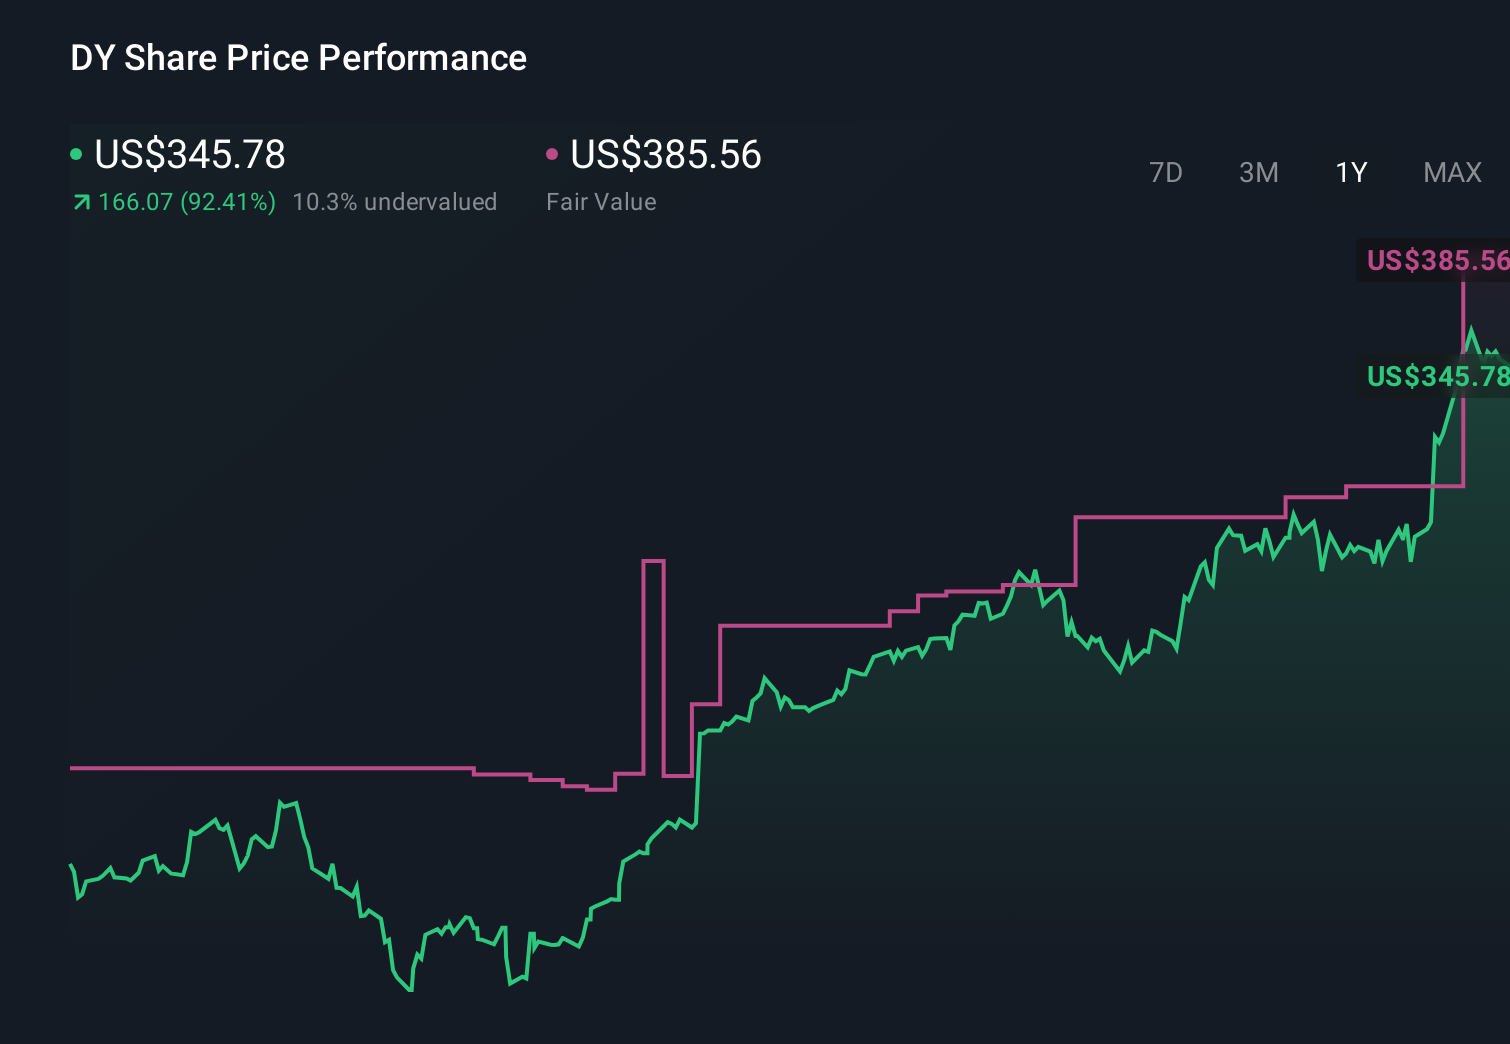
Check out Simply Wall St's in depth valuation analysis for Dycom Industries.
For the full picture including more risks and rewards, check out the complete Dycom Industries analysis.
This article by Simply Wall St is general in nature. We provide commentary based on historical data and analyst forecasts only using an unbiased methodology and our articles are not intended to be financial advice. It does not constitute a recommendation to buy or sell any stock, and does not take account of your objectives, or your financial situation. We aim to bring you long-term focused analysis driven by fundamental data. Note that our analysis may not factor in the latest price-sensitive company announcements or qualitative material. Simply Wall St has no position in any stocks mentioned.
