Please use a PC Browser to access Register-Tadawul
Enova International (ENVA) Earnings Jump 47.2% Challenges Longer Term Bearish Narratives
Enova International Inc ENVA | 145.33 | +0.21% |
Enova International's FY 2025 Earnings Snapshot
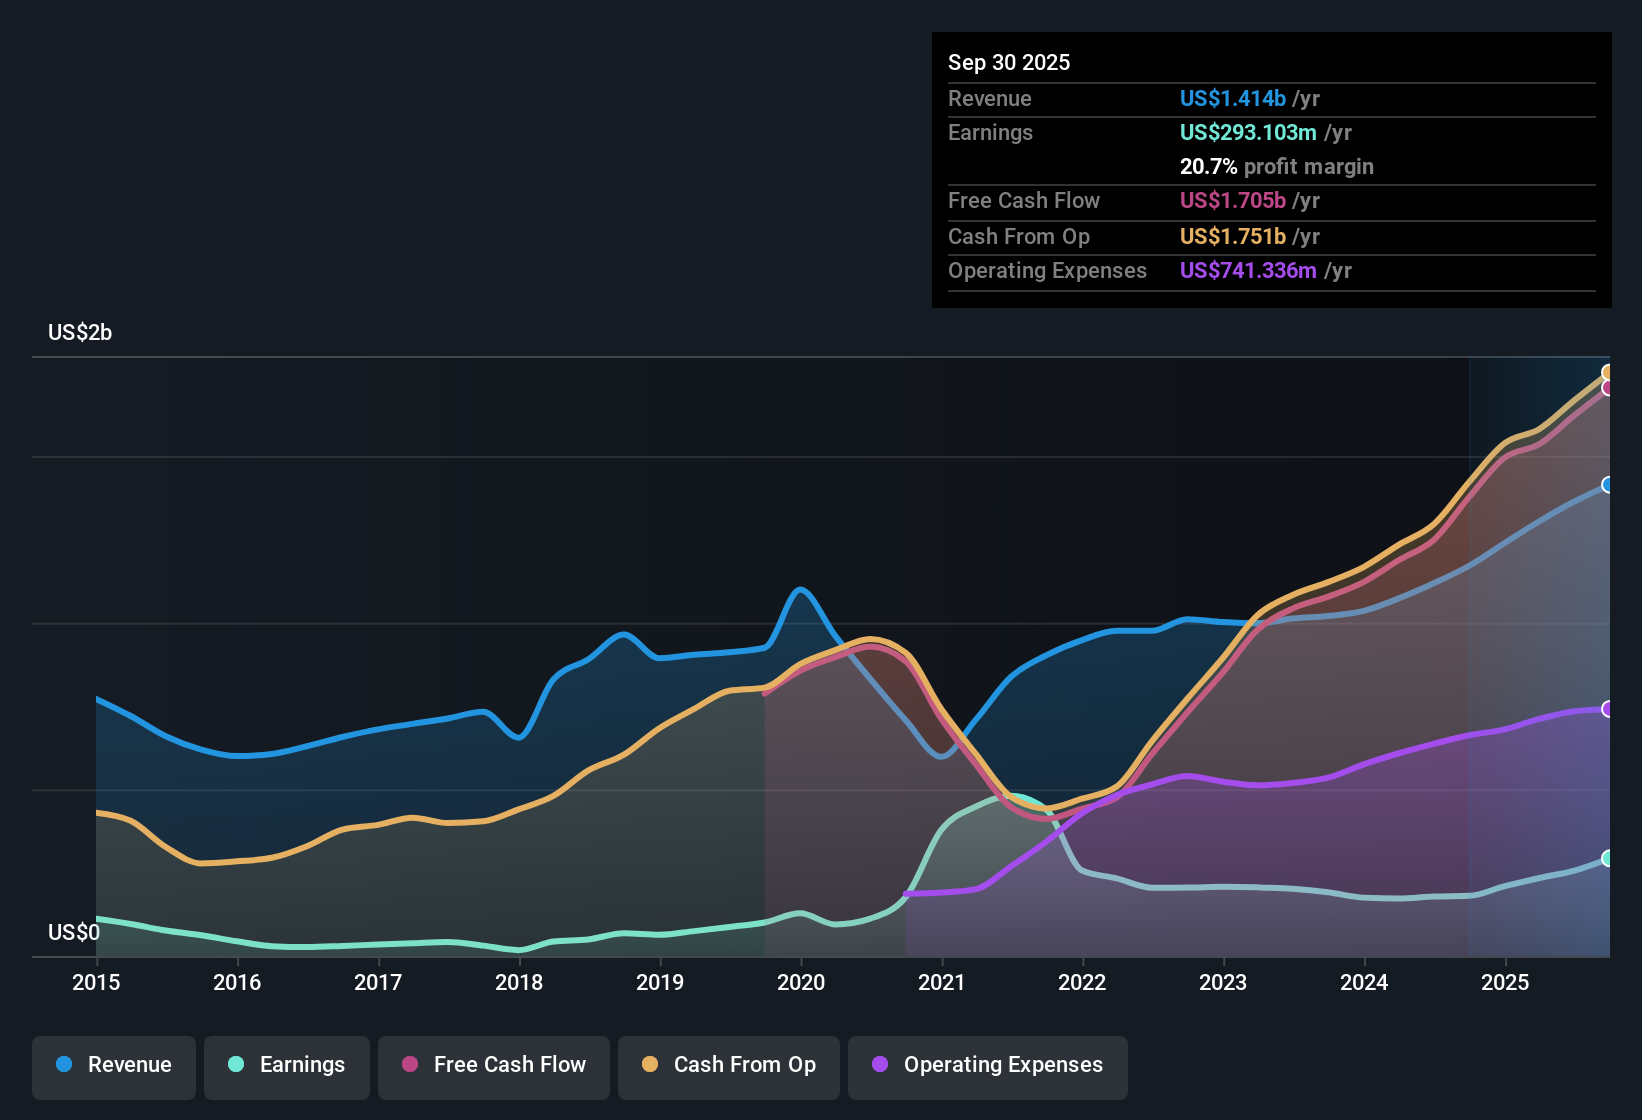
Enova International (ENVA) has capped FY 2025 with fourth quarter revenue of US$412.9 million and basic EPS of US$3.19, while trailing twelve month EPS sits at US$12.25 on revenue of about US$1.5 billion. The company has seen quarterly revenue move from US$323.5 million in Q3 2024 to US$412.9 million in Q4 2025, with basic EPS over that stretch ranging from US$1.64 to just above US$3 per share. With net margin at 20.7% over the last year versus 16.9% previously, the latest numbers indicate profitability that has become more supportive of the current earnings story.
See our full analysis for Enova International.With the headline results set, the next step is to compare these margins and growth figures with the widely followed narratives around Enova and to consider where the story investors tell themselves might differ from what the numbers suggest.
47.2% earnings jump over the year
- Over the last 12 months, net income was US$308.4 million on US$1.5b of revenue. This ties to the 47.2% year over year earnings gain and a trailing net margin of 20.7% compared with 16.9% a year earlier.
- What is striking for the bullish view is that this one year 47.2% earnings rise and 20.7% margin sit next to a five year earnings decline of about 12.3% per year. Supporters can point to the recent improvement, while critics can point to the longer term slide as a reminder that the current strength has not erased the older trend.
Revenue forecasts at 44.8% per year
- Revenue is forecast in the dataset to grow about 44.8% per year versus a 10.6% per year forecast for the wider US market, while trailing revenue over the last 12 months stands at about US$1.5b.
- Supporters of a more bullish angle often focus on that 44.8% revenue growth forecast and the 19.6% expected earnings growth. The current P/E of 12.8x and the five year earnings decline rate of 12.3% per year remind you that the market is still pricing in both growth potential and the history of weaker earnings at the same time.
- The relatively low P/E compared with a 19.3x US market multiple can be read as the market giving some credit for growth forecasts while still applying a discount.
- The contrast between strong recent earnings growth, the long run decline rate and those aggressive revenue forecasts is exactly where bullish and cautious views tend to split.
P/E of 12.8x versus US$81.24 DCF fair value
- ENVA trades on a trailing P/E of 12.8x, below the US market at 19.3x and below a peer average of 38.7x. The DCF fair value in the data is US$81.24 compared with a current share price of US$159.26.
- For investors leaning cautious, that gap between US$159.26 and the US$81.24 DCF fair value together with a high level of debt sits against the stronger 20.7% net margin and 47.2% earnings growth. The bearish angle leans on valuation and leverage, while the reported profitability gives them less room to argue that the business is currently struggling.
- The higher P/E than the 8.7x consumer finance industry average also fits that cautious stance, as it suggests the shares trade richer than many direct industry names even with the DCF pointing to a lower value.
- At the same time, the lack of substantial insider selling over the last three months is a counterpoint bears need to address when they argue the valuation is stretched.
Next Steps
Don't just look at this quarter; the real story is in the long-term trend. We've done an in-depth analysis on Enova International's growth and its valuation to see if today's price is a bargain. Add the company to your watchlist or portfolio now so you don't miss the next big move.
See What Else Is Out There
Enova's 47.2% one year earnings gain and 20.7% net margin sit against a five year earnings decline of about 12.3% per year and a DCF value well below the current share price.
If that mix of long term earnings pressure and valuation questions feels uncomfortable, use our these 876 undervalued stocks based on cash flows today to focus on ideas where the price tag appears more closely aligned with fundamentals.
This article by Simply Wall St is general in nature. We provide commentary based on historical data and analyst forecasts only using an unbiased methodology and our articles are not intended to be financial advice. It does not constitute a recommendation to buy or sell any stock, and does not take account of your objectives, or your financial situation. We aim to bring you long-term focused analysis driven by fundamental data. Note that our analysis may not factor in the latest price-sensitive company announcements or qualitative material. Simply Wall St has no position in any stocks mentioned.


