
Please use a PC Browser to access Register-Tadawul
Get It
Evaluating Fidelity National Financial (FNF) Valuation As Mixed Recent Returns Cool Longer Term Momentum
Fidelity National Financial, Inc. - FNF Group FNF | 52.13 | -3.84% |
Fidelity National Financial (FNF) is drawing attention after recent share price moves, with the stock closing at US$56.74 and showing mixed returns over the past month and past 3 months.
Recent trading has been choppy, with a 7.32% 1 month share price return and a 4.53% year to date share price return, while long term holders are sitting on a 54.12% 3 year total shareholder return and 82.99% over 5 years. This suggests momentum has cooled compared with the longer track record.
If this activity has you thinking about where else value might be hiding, it could be a good moment to scan our screener of 23 top founder-led companies and see what stands out.
With FNF trading at US$56.74 and sitting at a reported 43.81% discount to one estimate of intrinsic value, plus a 22.66% gap to an analyst price target, you have to ask: is there real upside here, or is the market already baking in future growth?
At $56.74, the most followed narrative points to a fair value of $70.25, so the current price sits below what those assumptions imply.
Diversification through the high-growth, fee-based F&G segment and new vehicles like the reinsurance "sidecar" strengthens the company's recurring earnings profile and reduces reliance on cyclical title revenues, supporting more stable long-term earnings and free cash flow.
Curious how a title insurer gets to that higher valuation marker? The story leans on steadier fee income, higher margins, and a different earnings mix than the market seems to be pricing in.
Result: Fair Value of $70.25 (UNDERVALUED)
However, it is worth keeping in mind that a prolonged real estate slowdown or persistent cost pressures from technology and staffing could easily undermine the potential for gains.
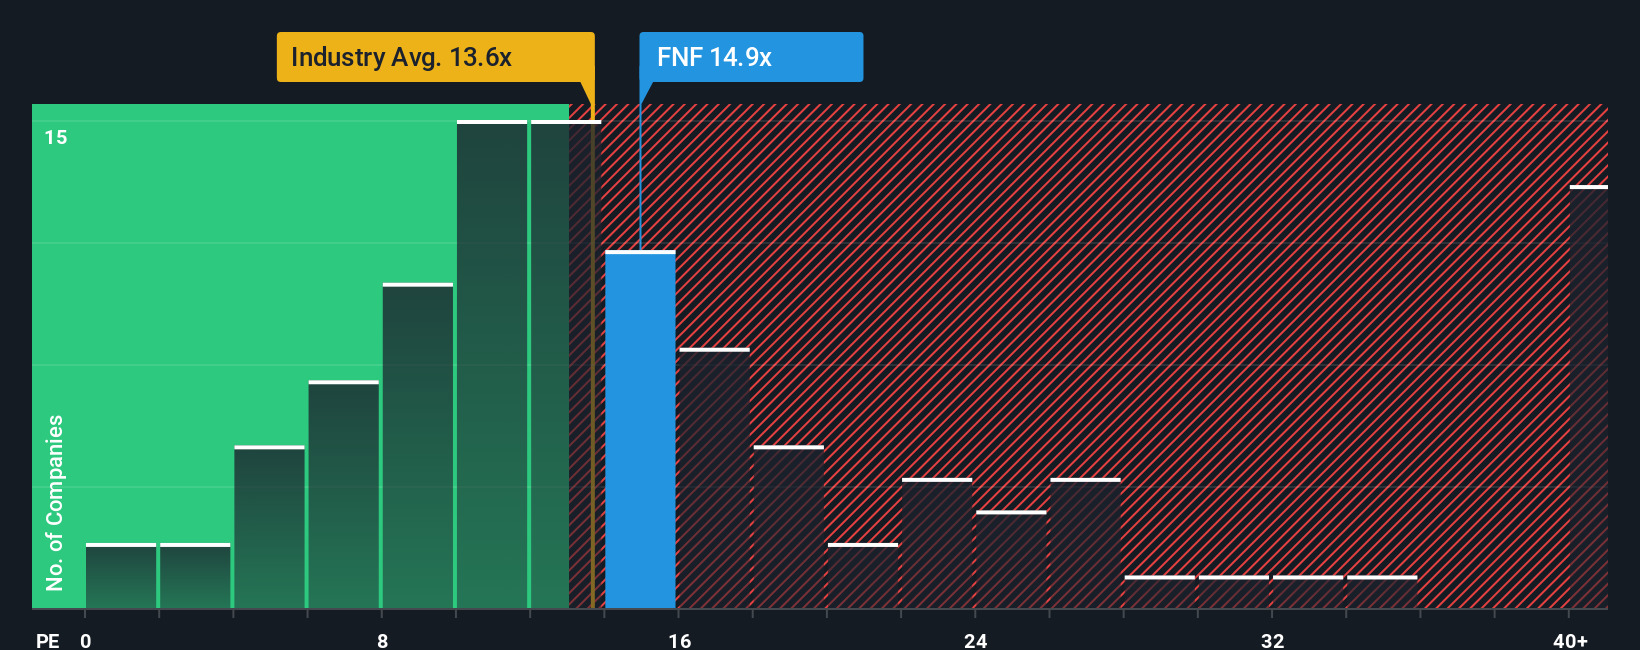
Those cash flow based estimates point to FNF being undervalued, but the P/E story is more cautious. At 13.2x earnings, the stock sits above the US Insurance group on 12.2x, yet below its own fair ratio of 17.8x and peer average of 14.5x. Is that a safety margin, or a warning that expectations already carry some optimism?
If the valuation angles here do not quite match your view, you can always lean on the data, test your own assumptions, and build a version that fits your investment style, Do it your way.
A great starting point for your Fidelity National Financial research is our analysis highlighting 5 key rewards and 1 important warning sign that could impact your investment decision.
If FNF has sharpened your thinking, do not stop here. Use the Simply Wall St Screener to quickly surface fresh ideas that match your style.
This article by Simply Wall St is general in nature. We provide commentary based on historical data and analyst forecasts only using an unbiased methodology and our articles are not intended to be financial advice. It does not constitute a recommendation to buy or sell any stock, and does not take account of your objectives, or your financial situation. We aim to bring you long-term focused analysis driven by fundamental data. Note that our analysis may not factor in the latest price-sensitive company announcements or qualitative material. Simply Wall St has no position in any stocks mentioned.
