
Please use a PC Browser to access Register-Tadawul
Get It
Evaluating Workday Shares After Software Giant's Strong Q1 Earnings in 2025
Workday, Inc. Class A WDAY | 224.49 | +0.20% |
If you are watching Workday’s share price and weighing your next move, you are not alone. The software giant continues to spark debate among investors and analysts about its true value. Over the short term, Workday’s stock has been a bit of a mixed bag, dipping 1.5% this week but climbing a healthy 5.4% over the last month. Despite some recent volatility, its long-term trajectory stands out with a 60.2% gain across three years, which is no small feat, even though the five-year growth is a more modest 4.7%. These numbers suggest both optimism about the company’s growth prospects and a dose of market caution, especially as new developments in the cloud software sector are rapidly shifting investor expectations.
There is also the question of risk. Workday’s shares are down 6.8% year-to-date and have slipped 2.3% over the last twelve months. Some of this reflects broader market sentiment rather than anything specific about Workday, though the company’s position in a competitive industry certainly factors in. What about valuation? In a simple scorecard looking at six major measures of undervaluation, Workday earns a 3. That means it passes three out of six checks, which is something worth considering as you decide whether to buy, hold, or sell.
With that context, let’s break down how analysts evaluate Workday’s valuation from different perspectives. Keep an eye out for a smarter way to make sense of it all at the end.
The Discounted Cash Flow (DCF) model estimates a company's intrinsic value by forecasting its future cash flows and discounting them back to today's value. This approach is popular for assessing companies like Workday because it focuses on cash generation potential rather than just earnings.
For Workday, the most recent Free Cash Flow stands at approximately $2.32 billion. Analysts expect this figure to steadily rise, with projections reaching about $5.02 billion by 2030. Notably, analysts typically supply estimates for up to five years. Further figures are based on extrapolations. The next decade of cash flow projections highlights a strong growth profile, which is crucial in underpinning the company’s intrinsic value today.
The DCF model calculates Workday’s fair value at $332.90 per share. This suggests the stock is trading at a 29.5% discount to its intrinsic value, indicating the market may be underpricing the company’s long-term cash-generating potential.
Result: UNDERVALUED
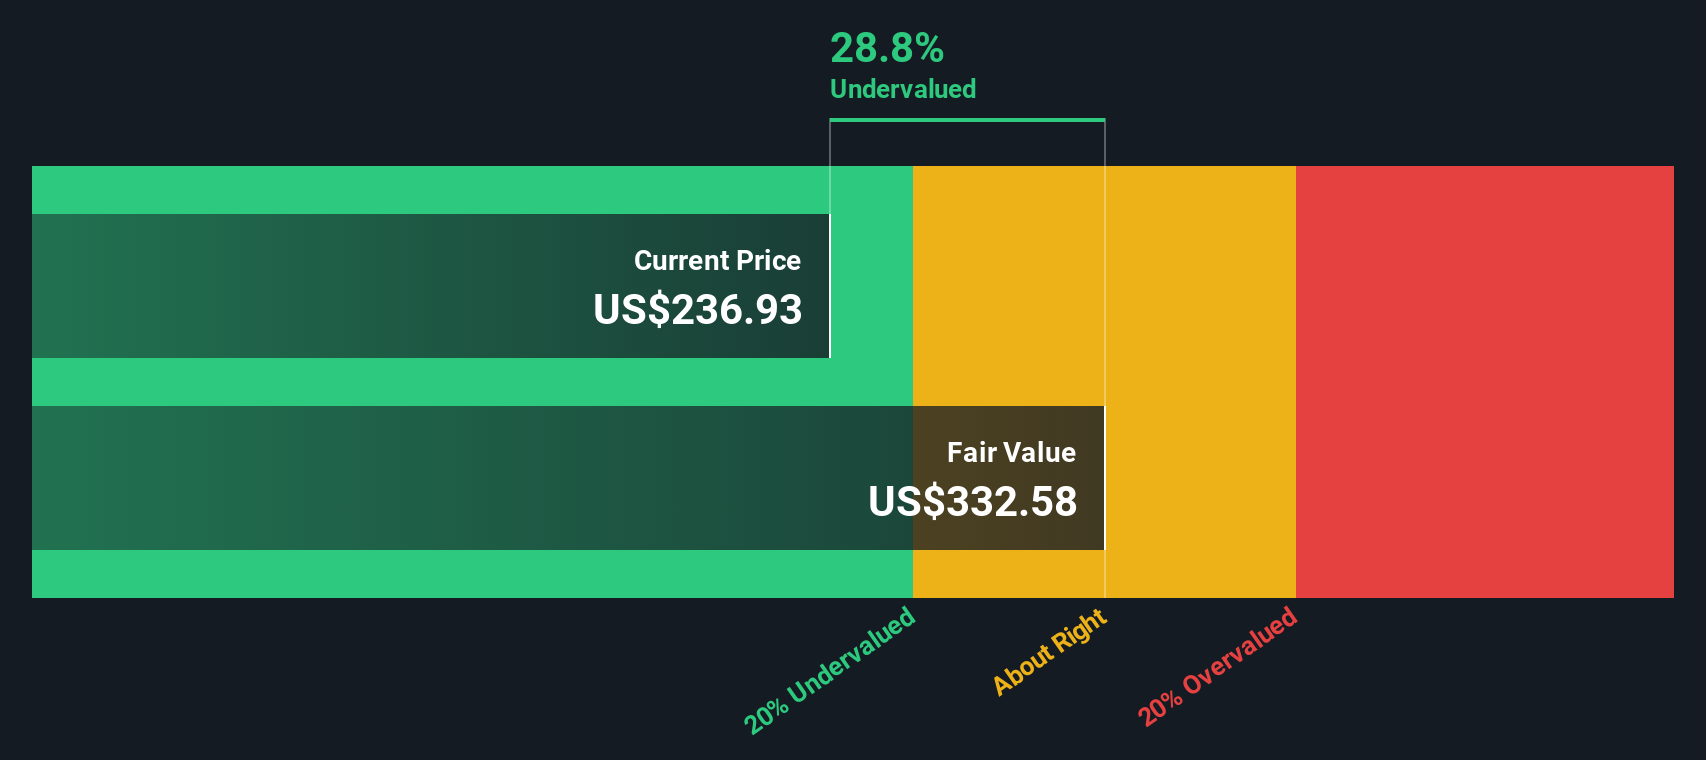
Our Discounted Cash Flow (DCF) analysis suggests Workday is undervalued by 29.5%. Track this in your watchlist or portfolio, or discover more undervalued stocks.
The Price-to-Earnings (PE) ratio is often considered the gold standard for valuing profitable companies like Workday because it directly connects a company’s market price with its underlying earnings. By looking at what investors are willing to pay for each dollar of profit, the PE ratio helps gauge whether a stock is expensive or cheap relative to those profits.
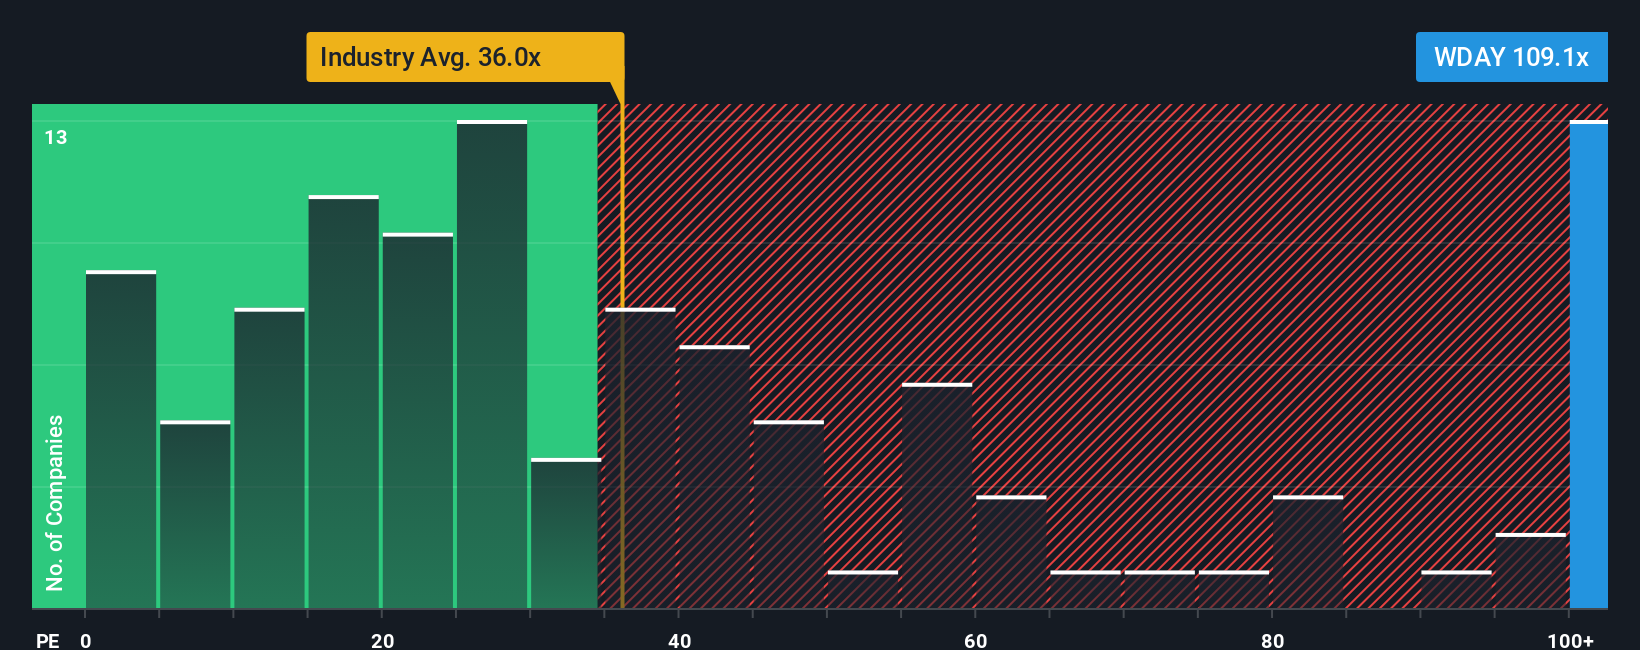
The “right” PE ratio is not set in stone and depends on factors such as the company’s future growth potential and the risks it faces. Fast-growing companies typically command higher PE ratios, while greater risks or market uncertainty tend to suppress them. For context, Workday currently trades at a PE ratio of 107.5x, which is significantly above the Software industry average of 34.9x and also higher than the peer group average of 63.5x. At first glance, this suggests the stock is valued at a substantial premium compared to its industry and peers.
This is where Simply Wall St’s unique “Fair Ratio” metric becomes relevant. Unlike simple industry or peer comparisons, the Fair Ratio builds in factors such as earnings growth, margins, the company’s size, and risk profile to determine what PE ratio is justified for Workday’s circumstances today. For Workday, the Fair Ratio is 55.3x, which is markedly lower than its actual PE multiple. Because the Fair Ratio reflects deeper fundamentals and context, it offers a more accurate baseline for judging value than just using averages.
Since Workday’s actual PE ratio is higher than its Fair Ratio, this points to the stock being overvalued using this measure.
Result: OVERVALUED
PE ratios tell one story, but what if the real opportunity lies elsewhere? Discover companies where insiders are betting big on explosive growth.
As hinted earlier, there is a more dynamic and insightful way to gauge a stock’s true potential: Narratives. A Narrative blends your perspective on a company’s story, such as its outlook for cloud-native and AI adoption, global expansion, and competitive risks, with the numbers you expect for future revenue, earnings, and margins. This ultimately connects these beliefs to your own fair value estimate.
This approach goes beyond static ratios by letting you tie together what matters most to you as an investor, making the process both intuitive and grounded in real data. Narratives are easily accessible to millions of investors through Simply Wall St’s Community page, where you can create, compare, and update your views as new events, earnings, or news come in. This ensures your analysis stays current.
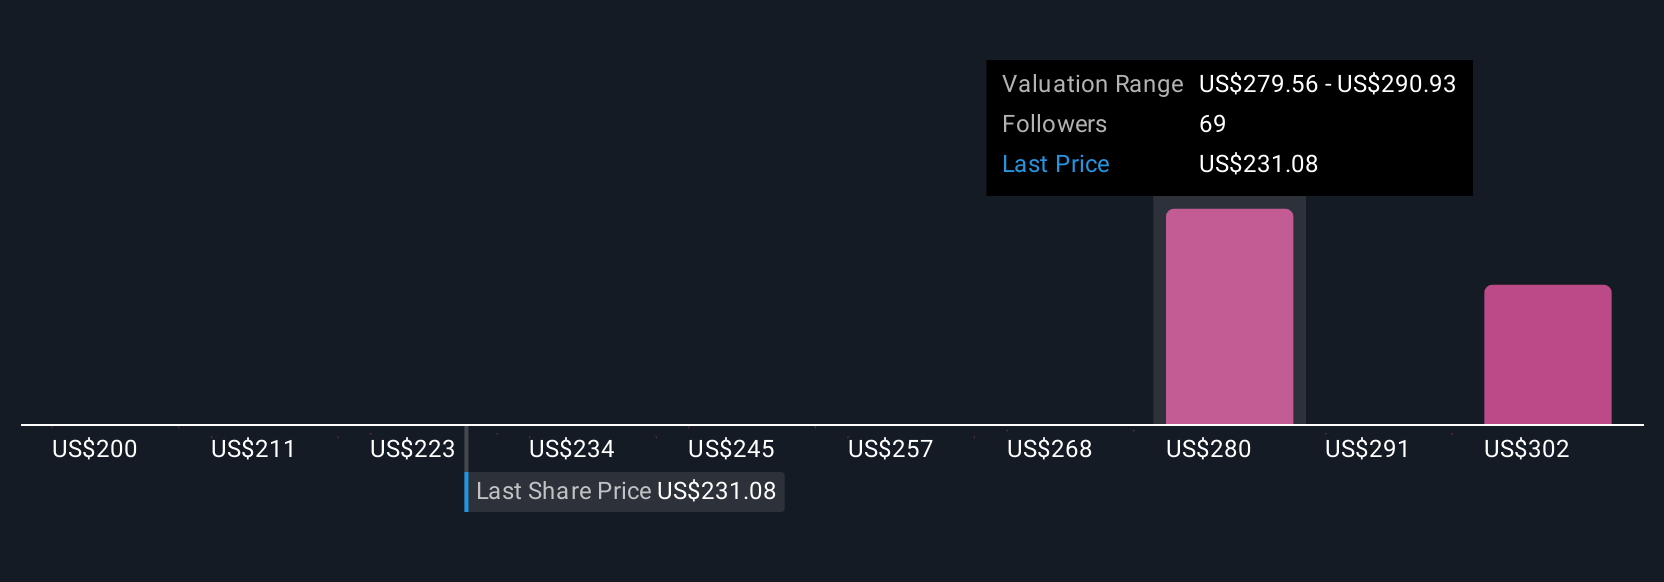
Using Narratives, you can quickly see if Workday’s current share price is above or below the Fair Value derived from your assumptions, helping inform your decision to buy or sell. For example, some investors see Workday’s fair value at $340 per share, driven by strong AI and international growth, while others are more cautious, setting it at $220 given competition and regulatory hurdles. This demonstrates how Narratives capture multiple valid perspectives in one simple tool.
Do you think there's more to the story for Workday? Create your own Narrative to let the Community know!
This article by Simply Wall St is general in nature. We provide commentary based on historical data and analyst forecasts only using an unbiased methodology and our articles are not intended to be financial advice. It does not constitute a recommendation to buy or sell any stock, and does not take account of your objectives, or your financial situation. We aim to bring you long-term focused analysis driven by fundamental data. Note that our analysis may not factor in the latest price-sensitive company announcements or qualitative material. Simply Wall St has no position in any stocks mentioned.
