
Please use a PC Browser to access Register-Tadawul
Get It
Expert Outlook: Procter & Gamble Through The Eyes Of 8 Analysts
Procter & Gamble Company PG | 167.13 167.18 | +2.07% +0.03% Post |
Analysts' ratings for Procter & Gamble (NYSE: PG) over the last quarter vary from bullish to bearish, as provided by 8 analysts.
The following table summarizes their recent ratings, shedding light on the changing sentiments within the past 30 days and comparing them to the preceding months.
| Bullish | Somewhat Bullish | Indifferent | Somewhat Bearish | Bearish | |
|---|---|---|---|---|---|
| Total Ratings | 1 | 3 | 4 | 0 | 0 |
| Last 30D | 0 | 1 | 0 | 0 | 0 |
| 1M Ago | 0 | 0 | 0 | 0 | 0 |
| 2M Ago | 0 | 2 | 1 | 0 | 0 |
| 3M Ago | 1 | 0 | 3 | 0 | 0 |
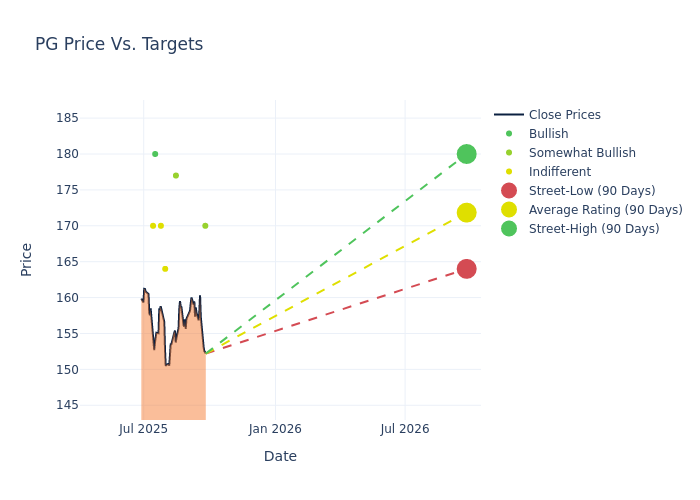
The 12-month price targets assessed by analysts reveal further insights, featuring an average target of $170.62, a high estimate of $180.00, and a low estimate of $161.00. A 2.5% drop is evident in the current average compared to the previous average price target of $175.00.
The standing of Procter & Gamble among financial experts is revealed through an in-depth exploration of recent analyst actions. The summary below outlines key analysts, their recent evaluations, and adjustments to ratings and price targets.
| Analyst | Analyst Firm | Action Taken | Rating | Current Price Target | Prior Price Target |
|---|---|---|---|---|---|
| Chris Carey | Wells Fargo | Lowers | Overweight | $170.00 | $173.00 |
| Kevin Grundy | BNP Paribas | Maintains | Outperform | $177.00 | $177.00 |
| Lauren Lieberman | Barclays | Raises | Equal-Weight | $164.00 | $161.00 |
| Chris Carey | Wells Fargo | Lowers | Overweight | $173.00 | $175.00 |
| Andrea Teixeira | JP Morgan | Lowers | Neutral | $170.00 | $178.00 |
| Peter Grom | UBS | Lowers | Buy | $180.00 | $186.00 |
| Lauren Lieberman | Barclays | Raises | Equal-Weight | $161.00 | $160.00 |
| Robert Ottenstein | Evercore ISI Group | Lowers | In-Line | $170.00 | $190.00 |
Capture valuable insights into Procter & Gamble's market standing by understanding these analyst evaluations alongside pertinent financial indicators. Stay informed and make strategic decisions with our Ratings Table.
Stay up to date on Procter & Gamble analyst ratings.
Since its founding in 1837, Procter & Gamble has become one of the world's largest consumer product manufacturers, with annual sales of nearly $85 billion. It operates with a lineup of leading brands, including more than 20 that generate north of $1 billion each in annual global sales, such as Tide laundry detergent, Charmin toilet paper, Pantene shampoo, and Pampers diapers. Sales outside its home turf represent just more than half of the firm's consolidated total.
Market Capitalization Highlights: Above the industry average, the company's market capitalization signifies a significant scale, indicating strong confidence and market prominence.
Positive Revenue Trend: Examining Procter & Gamble's financials over 3M reveals a positive narrative. The company achieved a noteworthy revenue growth rate of 1.74% as of 30 June, 2025, showcasing a substantial increase in top-line earnings. As compared to competitors, the company surpassed expectations with a growth rate higher than the average among peers in the Consumer Staples sector.
Net Margin: Procter & Gamble's financial strength is reflected in its exceptional net margin, which exceeds industry averages. With a remarkable net margin of 16.94%, the company showcases strong profitability and effective cost management.
Return on Equity (ROE): The company's ROE is below industry benchmarks, signaling potential difficulties in efficiently using equity capital. With an ROE of 6.89%, the company may need to address challenges in generating satisfactory returns for shareholders.
Return on Assets (ROA): Procter & Gamble's ROA falls below industry averages, indicating challenges in efficiently utilizing assets. With an ROA of 2.85%, the company may face hurdles in generating optimal returns from its assets.
Debt Management: Procter & Gamble's debt-to-equity ratio is below the industry average at 0.69, reflecting a lower dependency on debt financing and a more conservative financial approach.
Analysts work in banking and financial systems and typically specialize in reporting for stocks or defined sectors. Analysts may attend company conference calls and meetings, research company financial statements, and communicate with insiders to publish "analyst ratings" for stocks. Analysts typically rate each stock once per quarter.
Some analysts publish their predictions for metrics such as growth estimates, earnings, and revenue to provide additional guidance with their ratings. When using analyst ratings, it is important to keep in mind that stock and sector analysts are also human and are only offering their opinions to investors.
Breaking: Wall Street's Next Big Mover
Benzinga's #1 analyst just identified a stock poised for explosive growth. This under-the-radar company could surge 200%+ as major market shifts unfold. Click here for urgent details.
This article was generated by Benzinga's automated content engine and reviewed by an editor.
