How Gates Industrial's FY 2025 Earnings Stack Up Against the Story So Far
Gates Industrial (GTES) has just posted its FY 2025 third quarter numbers, with revenue at US$855.7 million and basic EPS of US$0.32 setting the tone for how the year is shaping up. The company has seen revenue move from US$829.4 million in Q4 2024 to US$855.7 million in Q3 2025, while basic EPS has tracked from US$0.14 to US$0.32 over the same stretch. This gives investors a clear view of how the top and bottom lines are translating into today’s 7% net margin story and slightly higher profitability than a year ago.
See our full analysis for Gates Industrial.
With those headline results on the table, the next step is to see how they line up against the widely followed narratives around Gates Industrial, highlighting where the numbers support the story and where they push back against it.
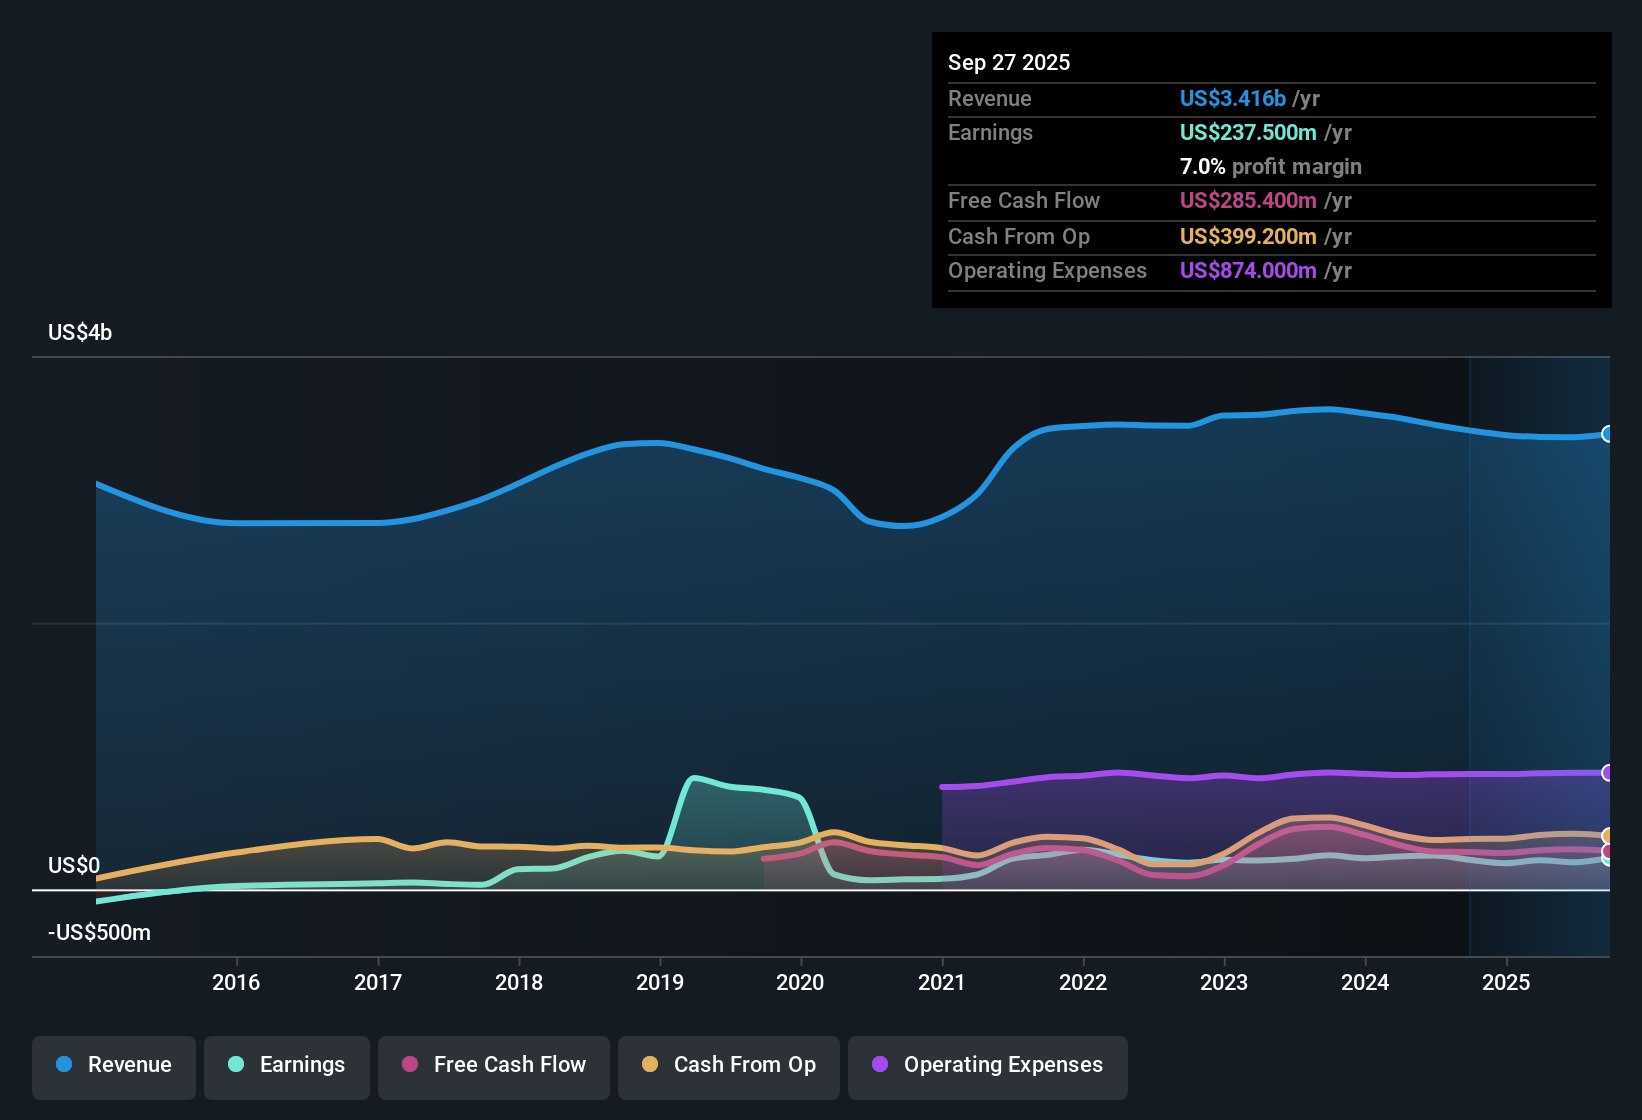
NYSE:GTES Earnings & Revenue History as at Feb 2026
Margins Steady Around 7% On US$3.4b TTM Sales
Over the last twelve months, Gates Industrial generated US$3.4b in revenue and US$237.5 million in net income, which works out to a 7% net margin compared with 6.5% the prior year in the risk summary.
Consensus narrative points to future margin opportunities in areas like data center liquid cooling and personal mobility. However, the current 7% margin and modest 3.7% annual revenue growth highlight that, so far, the core business is still anchored in slower moving industrial and automotive channels.
The bullish view leans on higher margin areas such as chain to belt conversions and e-bike applications. At the same time, the trailing 12 month revenue base of US$3.4b still mostly reflects traditional OEM and industrial demand in the data provided.
Analysts reference margin expansion potential from R&D and geographic diversification. The move from a 6.5% to 7% net margin in the risk summary gives some support to that view, even though the absolute margin level remains in single digits.
Analysts who back the bullish margin story are watching whether this 7% net margin on US$3.4b of sales is the starting point for the mix shift they expect, or just a pause before growth projects like data centers and personal mobility show up more clearly in the numbers.
🐂 Gates Industrial Bull Case
Valuation: 29.9x P/E And DCF Fair Value Of US$33.92
The shares trade on a 29.9x P/E, roughly in line with the US Machinery industry at 29.8x, while a DCF fair value of US$33.92 sits above the current US$27.53 share price in the data.
Consensus narrative talks about long term earnings growth drivers. The risk and valuation data show a mixed picture where a DCF fair value premium and a P/E below the 44.6x peer average sit alongside only 6.9% trailing earnings growth and revenue that has grown 3.7% per year.
Bulls argue that exposure to growing areas like data centers and personal mobility can justify paying near industry P/E multiples. The DCF fair value of US$33.92 versus the current US$27.53 gives numerical backing to that optimism in the dataset.
At the same time, the 6.9% trailing earnings growth and modest top line trend limit how aggressive that case looks. This is why the stock is described as trading near industry P/E levels rather than at the 44.6x peer average.
Debt Coverage Risk Versus 6.9% Earnings Growth
On the risk side, the data flag that debt is not well covered by operating cash flow over the last 12 months, even though earnings grew 6.9% in that period and net income reached US$237.5 million on a trailing basis.
Bears focus on high leverage and weaker coverage metrics, and the risk summary backs that concern by calling out poor cash flow coverage of debt. This sits in contrast to the 6.9% earnings growth and 7% net margin that the more optimistic narrative leans on.
Skeptics warn that if core industrial and automotive OEM markets stay soft, the weak debt coverage flagged could restrict how much the company can invest, regardless of the earnings growth and margin numbers in the latest trailing 12 month data.
The risk list also points to insider selling in the past three months, which bearish investors may treat as an extra caution signal on top of the leverage and debt coverage profile.
For readers tracking the more cautious view, the key tension is between that 6.9% earnings growth and the flagged debt coverage risk, and whether future cash flows will comfortably support both leverage and the growth projects analysts are watching.
🐻 Gates Industrial Bear Case
Next Steps
To see how these results tie into long-term growth, risks, and valuation, check out the full range of community narratives for Gates Industrial on Simply Wall St. Add the company to your watchlist or portfolio so you'll be alerted when the story evolves.
See the numbers differently? Take a couple of minutes to test your own view against the data and turn it into a clear narrative: Do it your way
A great starting point for your Gates Industrial research is our analysis highlighting 3 key rewards and 2 important warning signs that could impact your investment decision.
See What Else Is Out There
Gates Industrial is working with modest 3.7% annual revenue growth, 7% net margins and flagged weak debt coverage, which raises questions about resilience.
If that combination of leverage concerns and slow top line progress feels uncomfortable, compare it with companies in our 85 resilient stocks with low risk scores that prioritise stronger balance sheets and lower overall risk right now.
This article by Simply Wall St is general in nature. We provide commentary based on historical data and analyst forecasts only using an unbiased methodology and our articles are not intended to be financial advice. It does not constitute a recommendation to buy or sell any stock, and does not take account of your objectives, or your financial situation. We aim to bring you long-term focused analysis driven by fundamental data. Note that our analysis may not factor in the latest price-sensitive company announcements or qualitative material. Simply Wall St has no position in any stocks mentioned.