Great Southern Bancorp (GSBC) Net Interest Margin Stability Tests Bearish Regional Bank Narratives
Great Southern Bancorp, Inc. GSBC | 67.03 67.03 | +2.78% 0.00% Pre |
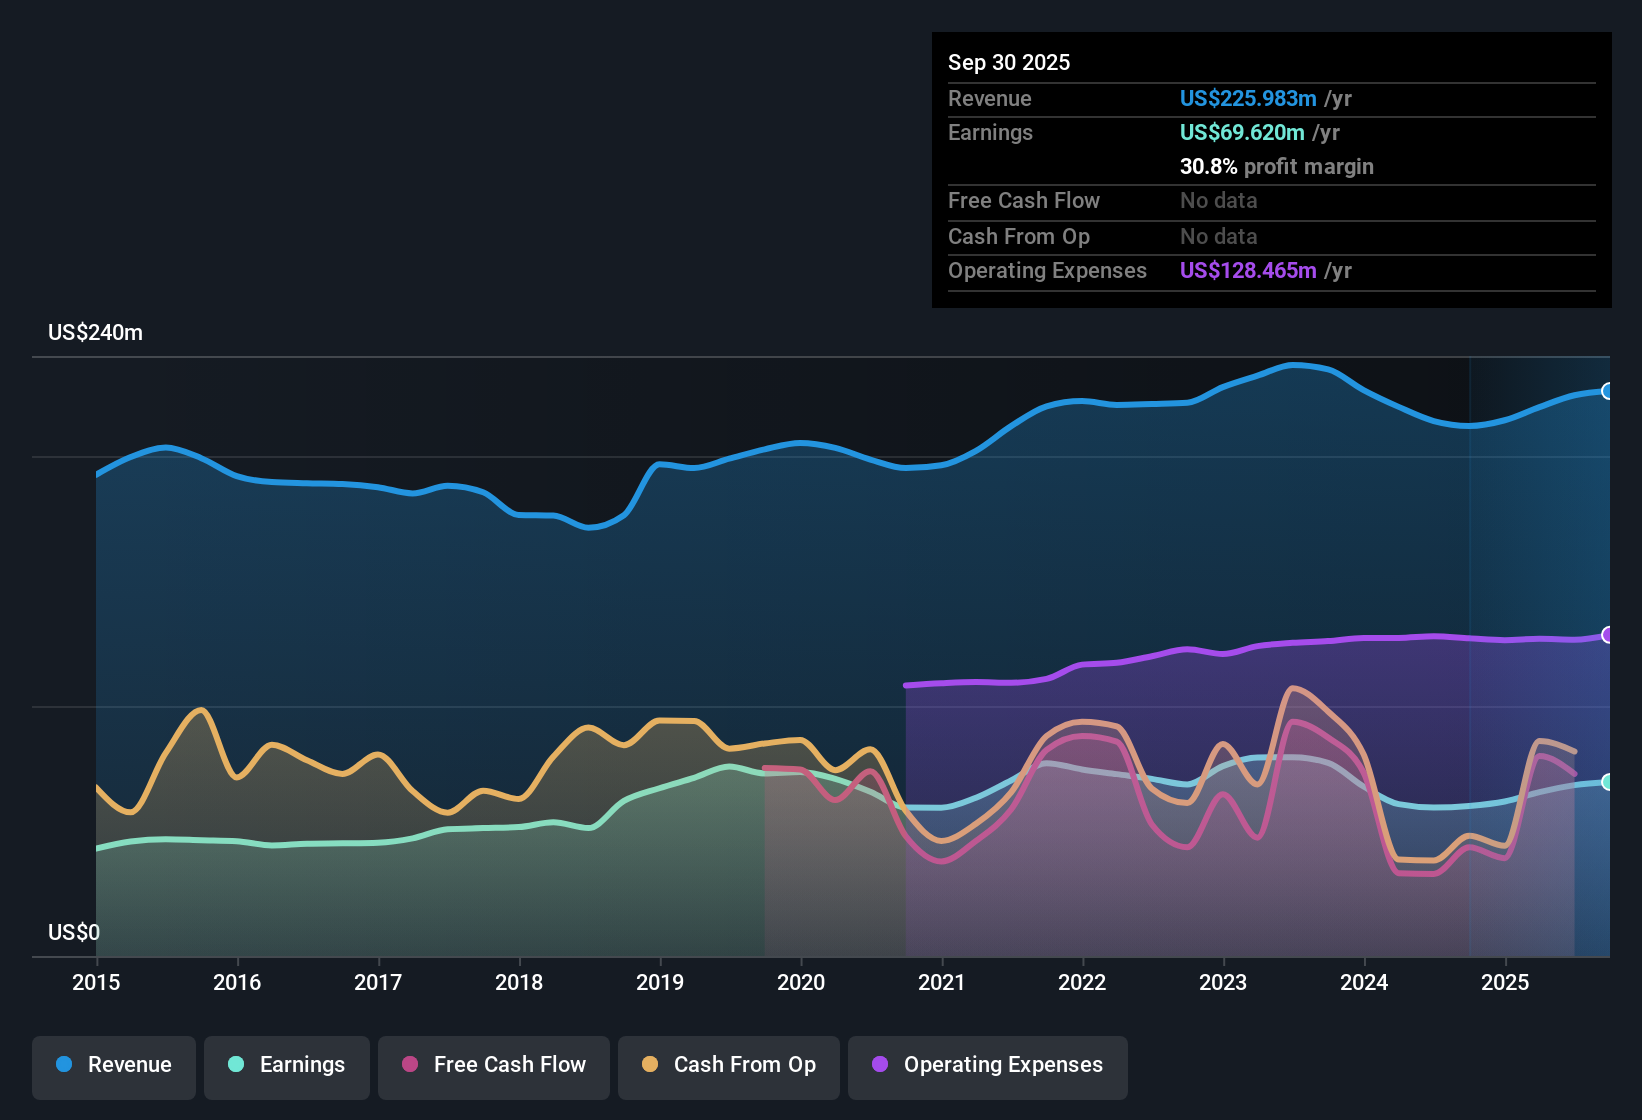
Great Southern Bancorp (GSBC) closed out FY 2025 with fourth quarter revenue of US$55.5 million and EPS of US$1.46. Trailing twelve month revenue came in at US$229.2 million and EPS at US$6.23, up from US$214.3 million and US$5.28 a year earlier. That step up in the revenue and EPS base sets the stage for a period where margins and earnings quality will matter more than headline growth, as investors weigh how durable these results look heading into the next year.
See our full analysis for Great Southern Bancorp.With the latest numbers on the table, the next step is to see how this earnings profile lines up against the dominant narratives around GSBC, and where the story the data tells may differ from what the market expects.
Margins hold steady around 3.7% NIM
- GSBC’s net interest margin sits in a tight band for FY 2025, between 3.57% and 3.72% across the four quarters, with the latest quarter at 3.7% and the trailing twelve month figure at 3.67%.
- What supports a mildly bullish take on GSBC as a steady regional bank is that this margin consistency comes alongside a trailing net profit margin of 31% and full year net income of US$70.97 million, which:
- Lines up with the view of GSBC as a conservative, income focused bank where earnings quality matters more than fast growth.
- Contrasts with concerns that regional banks might face sharp margin compression, because here the reported NIM range across 2025 is relatively narrow.
Cost to income sits near 62%
- On a trailing basis GSBC reports a cost to income ratio of 61.91%, with quarterly readings in FY 2025 between 59.16% and 63.89%, showing the bank is spending roughly US$6 out of every US$10 of revenue on operating costs.
- Bears who worry about regional bank efficiency get a mixed picture here, because:
- The 59.16% cost to income low in Q2 2025 points to periods of tighter cost control, while the 63.89% ratio in Q4 2025 shows expenses can still weigh on profitability in some quarters.
- Even with these expense levels, trailing EPS of US$6.23 and net income of US$70.97 million indicate that margins are still strong enough to support that 31% net profit margin flagged in the analysis summary.
Valuation gap vs 31% margin
- GSBC trades on a trailing P/E of 10.3x at a share price of US$66.35, compared with a DCF fair value of US$137.67 and peer and US Banks averages of 13.2x and 12.1x, while still posting a 31% net margin and a 2.59% dividend yield.
- Supporters of the bullish view see this combination as attractive, yet the earnings track record adds some tension, because:
- Trailing earnings growth of 14.8% over the last year sits against a longer term five year annualized earnings decline of 1.1% per year, so the recent strength is not a straight line trend.
- Forecasts in the dataset point to an average 12.8% earnings decline per year over the next three years and a small 0.07% annual revenue decline, which could help explain why the market keeps the P/E below peers despite the DCF fair value being more than double the current price.
Next Steps
Don't just look at this quarter; the real story is in the long-term trend. We've done an in-depth analysis on Great Southern Bancorp's growth and its valuation to see if today's price is a bargain. Add the company to your watchlist or portfolio now so you don't miss the next big move.
See What Else Is Out There
GSBC’s mix of a 31% net margin, along with forecasts in the dataset for annual earnings and revenue declines, highlights a potential gap in long term growth confidence.
If you want ideas that lean toward consistent expansion instead of possible step downs, check out CTA_SCREENER_STABLE_GROWTH to focus on companies with steadier earnings profiles.
This article by Simply Wall St is general in nature. We provide commentary based on historical data and analyst forecasts only using an unbiased methodology and our articles are not intended to be financial advice. It does not constitute a recommendation to buy or sell any stock, and does not take account of your objectives, or your financial situation. We aim to bring you long-term focused analysis driven by fundamental data. Note that our analysis may not factor in the latest price-sensitive company announcements or qualitative material. Simply Wall St has no position in any stocks mentioned.