Healthcare Services Group (HCSG) has put a more upbeat marker down for FY 2025, with Q3 revenue of US$464.3 million and EPS of US$0.59, alongside net income of US$43.0 million. The company has seen revenue move from US$428.1 million in Q3 2024 to US$464.3 million in Q3 2025, while EPS shifted from US$0.19 to US$0.59 and net income from US$14.0 million to US$43.0 million. This sets up a story where leaner margins and an earnings track record sit at the center of how investors read this update.
See our full analysis for Healthcare Services Group.
With the headline numbers on the table, the next step is to line them up against the most common market narratives around HCSG’s earnings quality, margin profile and long term direction to see which views still hold and which might need a rethink.
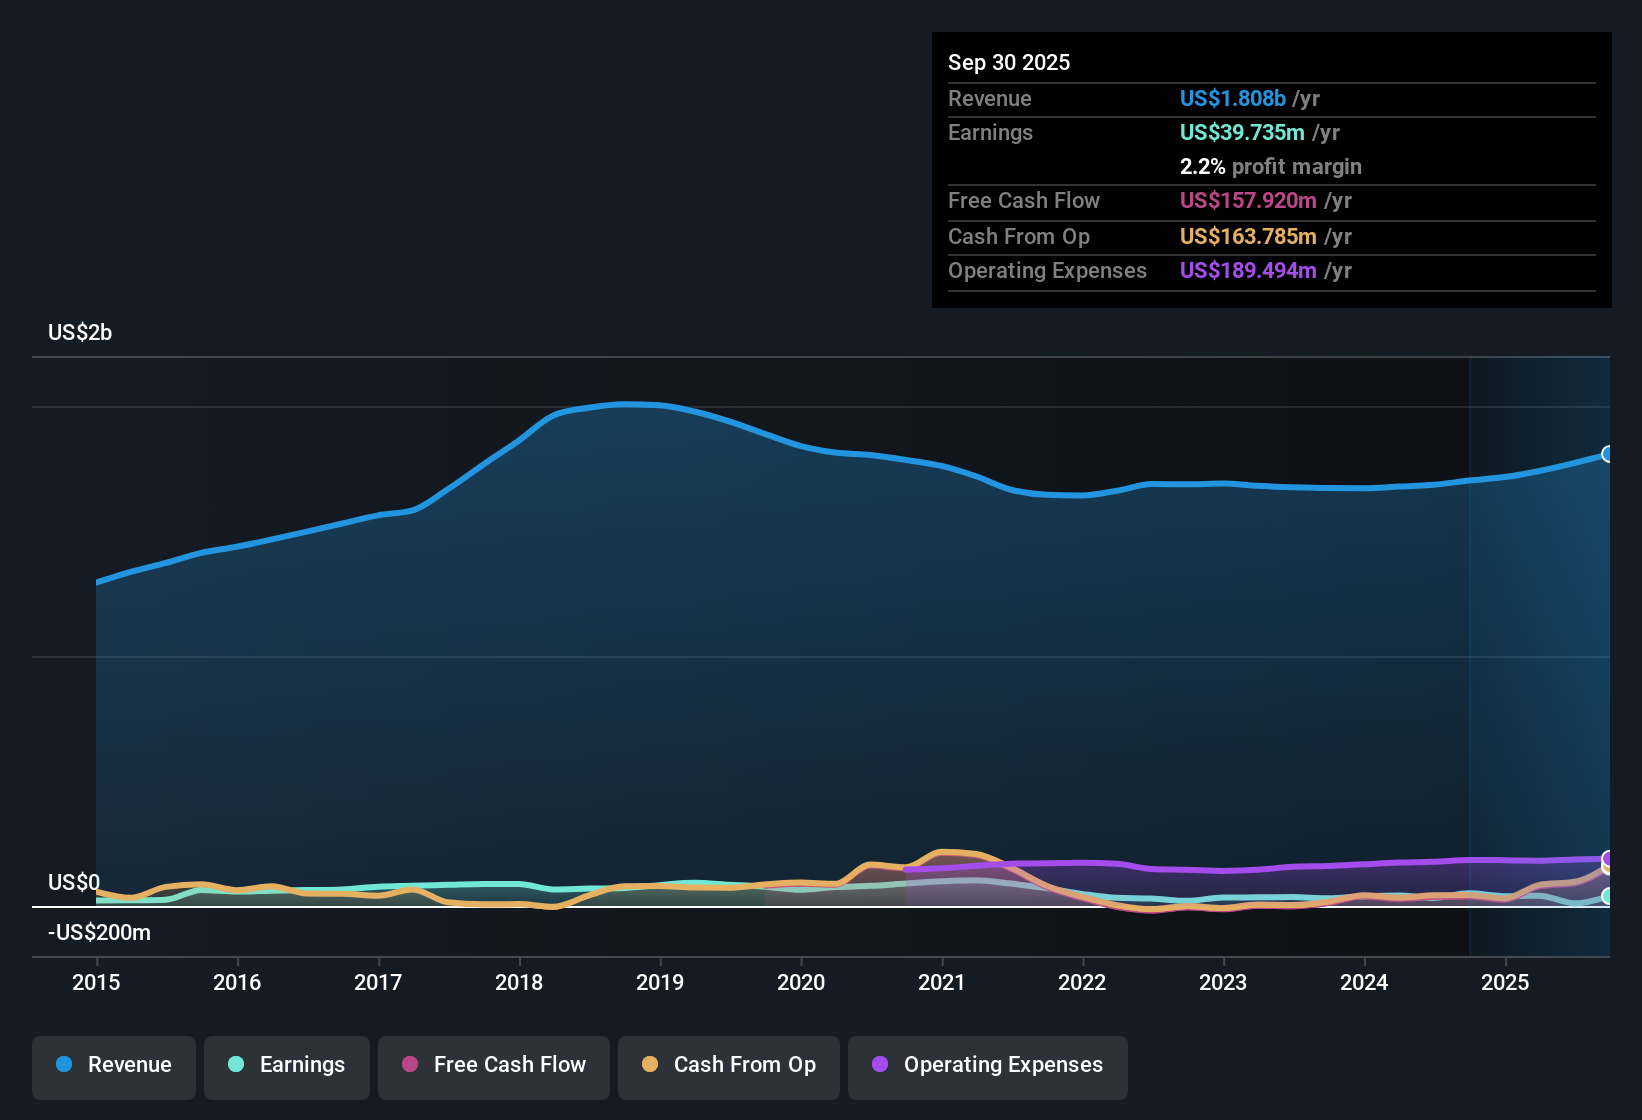
NasdaqGS:HCSG Earnings & Revenue History as at Feb 2026
Margins Under Pressure At 2.2%
Over the last 12 months, HCSG’s net profit margin was 2.2%, compared with 3.0% in the prior year, on trailing revenue of about US$1.8b.
Analysts' consensus view expects cost control and contract flexibility to support margin improvement, yet the step down from a 3.0% margin to 2.2% shows that margin pressure is still very present:
The consensus narrative talks about SG&A and cost of services drifting lower as a share of revenue, while trailing data instead points to profitability being squeezed.
That creates a clear test for the consensus case that operational improvements and bundled services can translate into stronger, more consistent earnings than the recent margin profile suggests.
Five Year Earnings Slide Of 23.7%
Over the past five years, earnings have declined at a compounded rate of 23.7% per year, even though trailing 12 month net income stands at US$39.7 million on about US$1.8b of revenue.
Critics highlight this multi year earnings decline as a key risk to the bearish side of the narrative, and the recent figures give that view plenty of backing:
The trailing earnings profile, with a 2.2% net margin and a 23.7% annual earnings decline, lines up with concerns that growth initiatives may not fully offset pressures from client concentration and labor costs.
Episodes like the Q2 2025 loss of US$32.4 million and Basic EPS of US$0.44 loss show how quickly reported profits can swing when large clients or sector wide cost issues flare up.
A sharp five year earnings slide like this is exactly what skeptics focus on when they question how much profit recovery is already priced in for HCSG.
🐻 Healthcare Services Group Bear Case
P/E Of 39.5x Versus DCF Value
HCSG trades on a trailing P/E of 39.5x, above both the US Commercial Services industry average of 25.7x and peer average of 25.5x, while a DCF fair value of US$27.94 compares with a current share price of US$22.28.
What is interesting for the bullish side of the consensus narrative is this mix of a premium P/E and a discount to DCF fair value:
The roughly 20.3% gap between the DCF fair value of US$27.94 and the current price of US$22.28 sits alongside trailing earnings that are described as high quality, which supports the idea that fundamentals could justify more than the market is currently willing to pay.
At the same time, paying 39.5x trailing earnings when industry peers sit closer to 25x means the bullish view leans heavily on the expectations that revenue around US$1.8b and the current 2.2% margin can improve meaningfully over time.
Bulls point to that gap between the premium P/E and the lower share price versus DCF fair value as the key reason they stay interested in HCSG.
🐂 Healthcare Services Group Bull Case
Next Steps
To see how these results tie into long-term growth, risks, and valuation, check out the full range of community narratives for Healthcare Services Group on Simply Wall St. Add the company to your watchlist or portfolio so you'll be alerted when the story evolves.
See the numbers differently? If this update sparks a different take, shape your own view in just a few minutes and share it with others. Do it your way
A great starting point for your Healthcare Services Group research is our analysis highlighting 1 key reward and 1 important warning sign that could impact your investment decision.
See What Else Is Out There
HCSG’s 2.2% net margin, five year 23.7% annual earnings slide and premium 39.5x P/E all point to pressure on profitability and valuation risk.
If those pressure points make you want steadier upside, take a few minutes to scan our 85 resilient stocks with low risk scores that focus on more resilient earnings and lower downside risk.
This article by Simply Wall St is general in nature. We provide commentary based on historical data and analyst forecasts only using an unbiased methodology and our articles are not intended to be financial advice. It does not constitute a recommendation to buy or sell any stock, and does not take account of your objectives, or your financial situation. We aim to bring you long-term focused analysis driven by fundamental data. Note that our analysis may not factor in the latest price-sensitive company announcements or qualitative material. Simply Wall St has no position in any stocks mentioned.