Hingham Institution For Savings FY 2025 Net Interest Margin Rebound Challenges Bearish Narratives
Hingham Institution for Savings HIFS | 284.91 | -0.74% |
How Hingham Institution for Savings' FY 2025 Numbers Set Up the Earnings Story
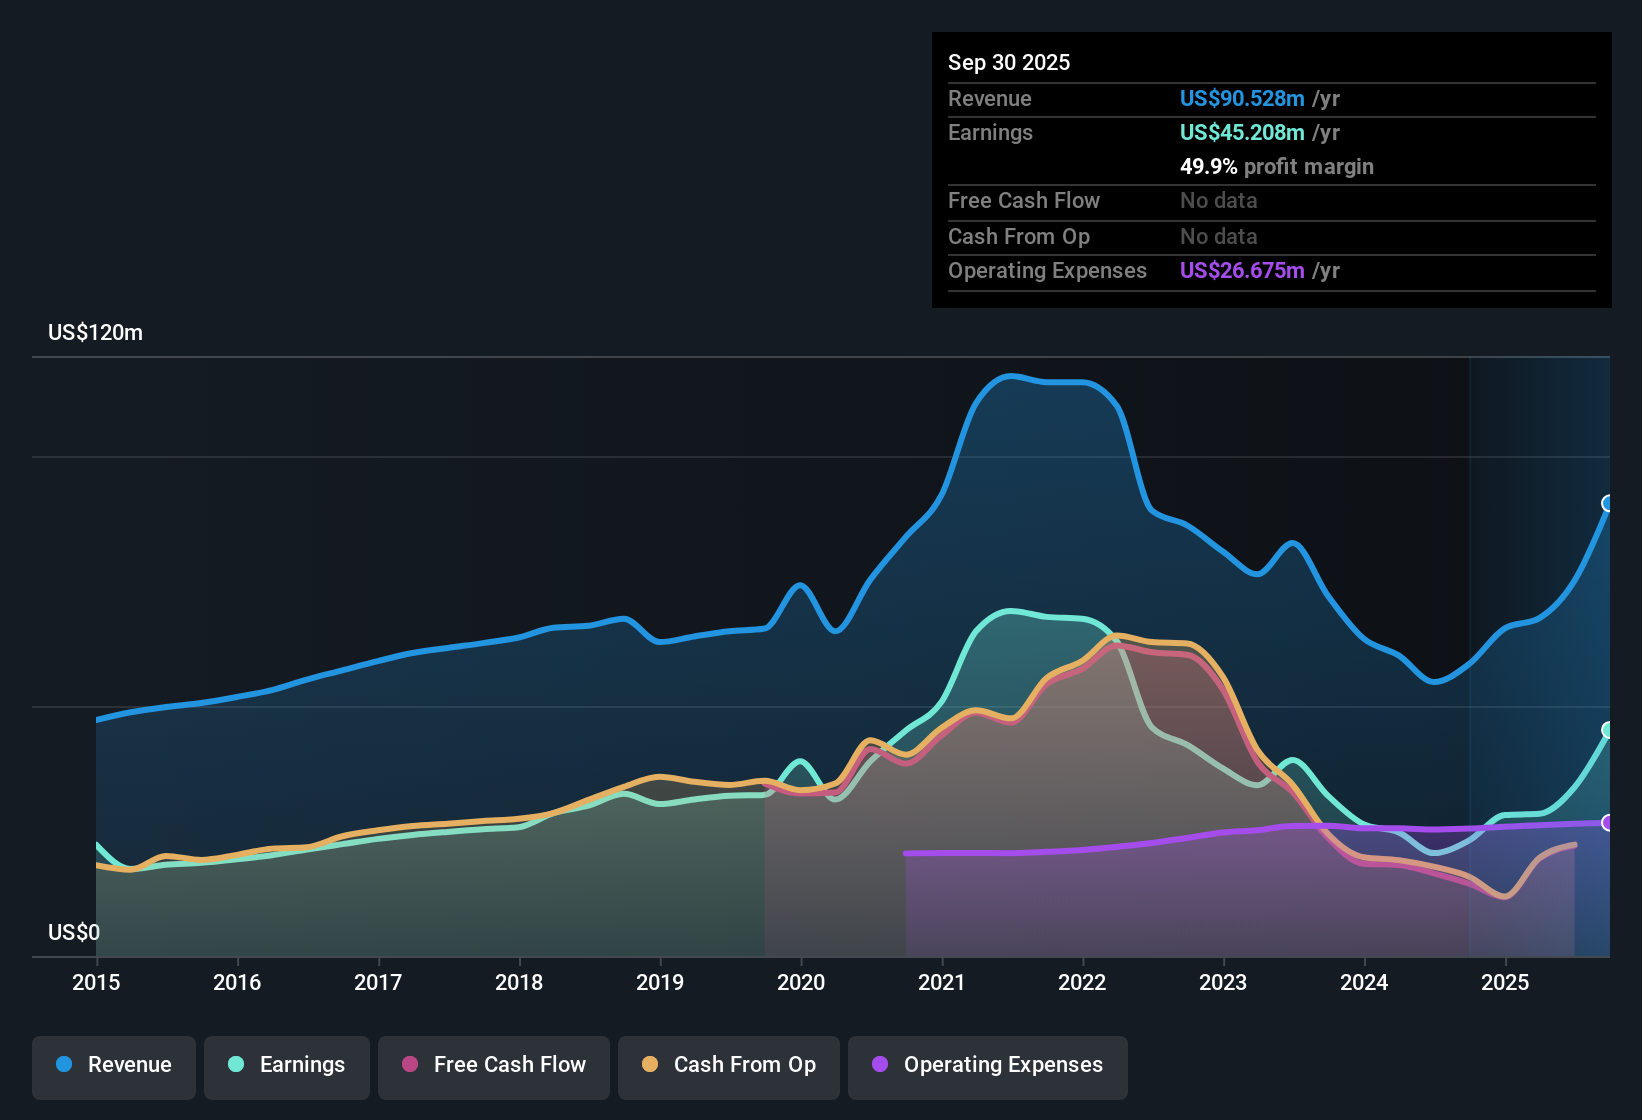
Hingham Institution for Savings (HIFS) closed FY 2025 with fourth quarter total revenue of US$34.5 million and basic EPS of US$9.49, while trailing twelve month revenue reached US$102.8 million and EPS came in at US$25.01, setting a clear earnings marker for investors to work from. Over the past year, revenue has moved from US$65.5 million and EPS of US$12.95 on a trailing basis in Q4 2024 to US$102.8 million and EPS of US$25.01 in Q4 2025, giving a clean view of how the top line and per share profits have tracked together. With a trailing net profit margin of 53.1% and a net interest margin of 1.7%, the latest results put the focus squarely on how durable these profitability levels look against the recent history of earnings pressure.
See our full analysis for Hingham Institution for Savings.With the headline numbers on the table, the next step is to set them against the widely followed narratives around HIFS to see which views line up with the data and which ones the latest results call into question.
Net Interest Margin and Costs Move Together
- Across FY 2025, Hingham's quarterly net interest margin moved from 1.5% in Q1 to 1.89% in Q4, while the cost to income ratio shifted from 45.82% to 35.06% over the same period.
- What stands out for a bullish view is how profitability metrics line up, with the latest trailing net profit margin at 53.1%, quarterly net interest margin in Q4 at 1.89%, and the cost to income ratio at 35.06%. Taken together, these figures suggest earnings quality that bullish investors often point to when they highlight banks with relatively efficient operations and solid spreads.
- Supporters may point out that the trailing cost to income ratio of 39.7% sits between the Q1 and Q4 quarterly levels, which fits with a story of tighter cost control alongside revenue of US$102.8 million over the last 12 months.
- They may also connect the 93.5% year over year earnings growth to this mix of margins and costs, arguing that such figures help explain how EPS reached US$25.01 on a trailing basis.
Rapid EPS Swing Versus 5 Year Decline
- On a trailing basis, EPS moved from US$12.95 in Q4 2024 to US$25.01 in Q4 2025, a 93.5% year over year earnings increase, even though earnings over the past five years declined at an average rate of 15.9% per year.
- Critics focus on that 15.9% annual earnings decline over five years and argue that the recent 93.5% rebound may sit uncomfortably against the longer trend, and the quarterly pattern in FY 2025 gives them some material to work with.
- They can point out that quarterly basic EPS ranged from US$3.27 in Q1 to US$9.49 in Q4 of 2025, which shows a sharp swing within a single year compared with the multi year decline highlighted in the risk summary.
- Bears may use this contrast to question how representative the latest trailing EPS of US$25.01 really is when set against the five year decline and the earlier quarters of FY 2025.
Valuation Gap and Credit Provisioning Flag
- The P/E of 11.8x sits below the peer average of 14.2x and below the US market at 19.4x, yet the DCF fair value of US$136.23 is well below the cited share price of US$294.66, and the allowance for bad loans is described as low at 87%.
- Bears argue that the mix of a low allowance for bad loans and the gap between the DCF fair value and the current share price puts extra focus on downside risk, and the credit data across FY 2025 gives some context for that concern.
- For example, non performing loans on a trailing basis rose from US$1.83 million in Q1 2025 to US$31.89 million in Q2 2025 while the allowance level is flagged at 87%, which critics may see as not leaving much room if credit quality weakens further.
- They may also argue that even with a P/E below peers, the combination of a DCF fair value of US$136.23 and a current share price of US$294.66 means investors are paying a large premium to that DCF estimate while accepting the low allowance figure.
Next Steps
Don't just look at this quarter; the real story is in the long-term trend. We've done an in-depth analysis on Hingham Institution for Savings's growth and its valuation to see if today's price is a bargain. Add the company to your watchlist or portfolio now so you don't miss the next big move.
See What Else Is Out There
The mix of a P/E above its DCF fair value, a flagged 87% allowance for bad loans, and higher non performing loans leaves some investors uneasy about risk.
If that combination feels too exposed for your taste, shift your focus to solid balance sheet and fundamentals stocks screener (1940 results) today and zero in on companies with sturdier financial cushions and cleaner credit profiles.
This article by Simply Wall St is general in nature. We provide commentary based on historical data and analyst forecasts only using an unbiased methodology and our articles are not intended to be financial advice. It does not constitute a recommendation to buy or sell any stock, and does not take account of your objectives, or your financial situation. We aim to bring you long-term focused analysis driven by fundamental data. Note that our analysis may not factor in the latest price-sensitive company announcements or qualitative material. Simply Wall St has no position in any stocks mentioned.