
Please use a PC Browser to access Register-Tadawul
Get It
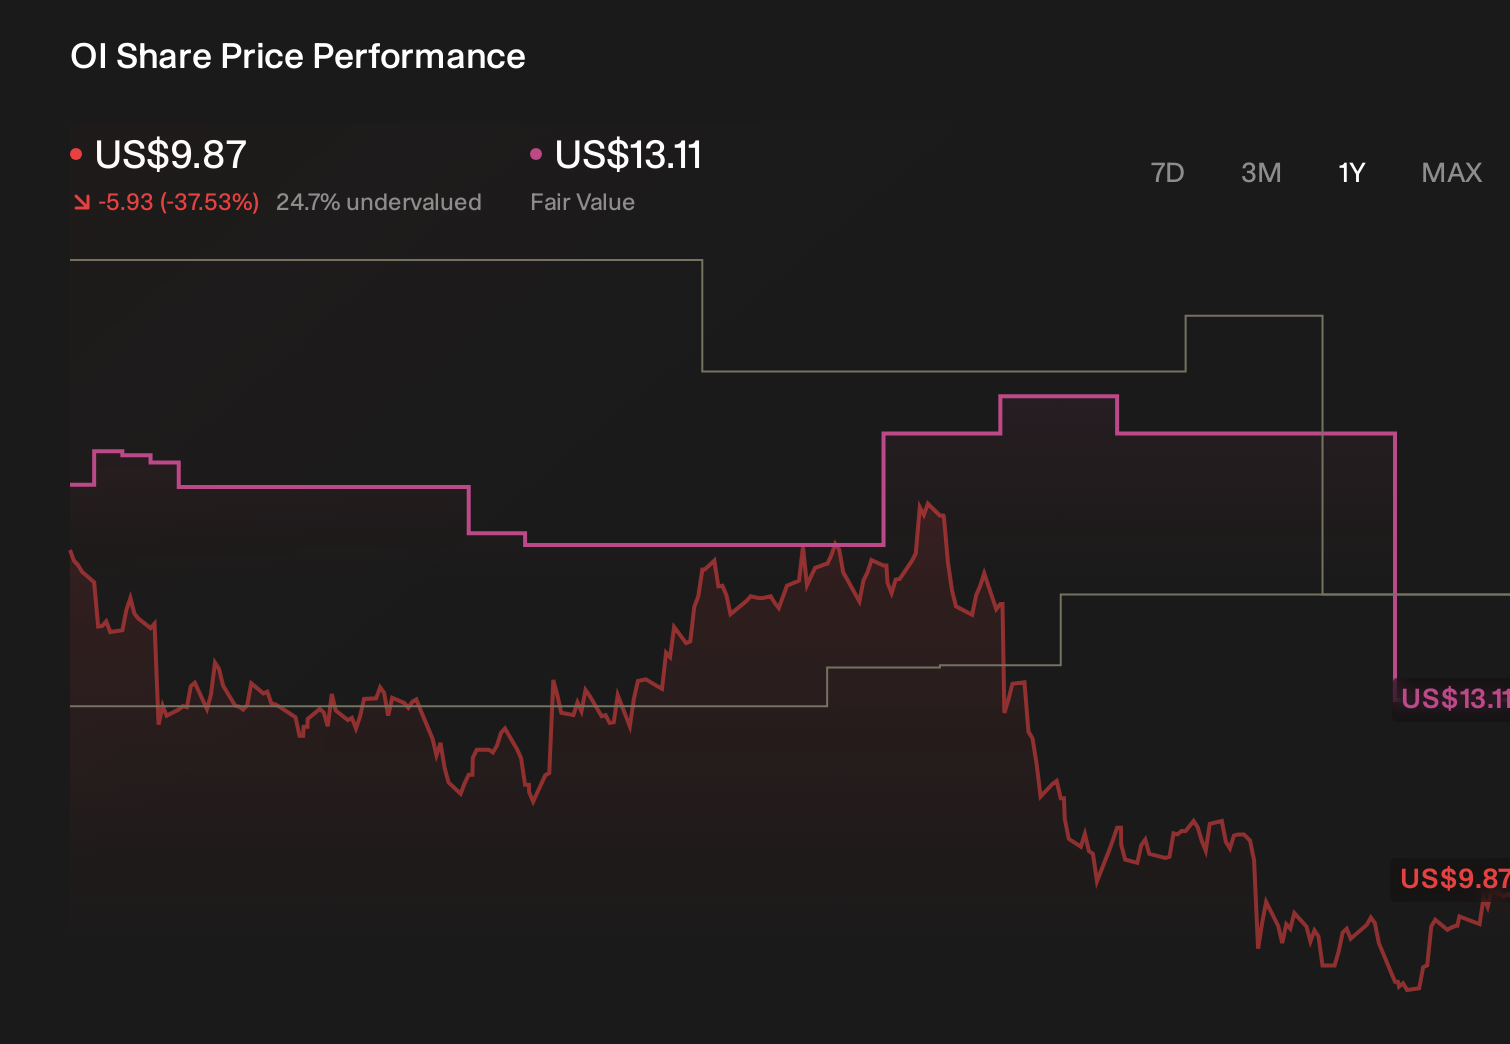
How Investors Are Reacting To O-I Glass (OI) Golden Cross And Upward Earnings Revisions
Owens-Illinois, Inc. OI | 14.97 14.97 | +0.20% 0.00% Post |
Outshine the giants: these 24 early-stage AI stocks could fund your retirement.
To own O-I Glass, you need to believe that a traditional glass packager can restore consistent profitability through cost efficiency and tighter capacity management, despite modest revenue expectations and industry substitution pressure. The recent golden cross and upgraded earnings estimates support the near term earnings recovery story, but they do not materially reduce the key risk of persistent volume softness in Europe and the ongoing need to align production capacity with demand.
The recent Q3 2025 results, which showed a return to quarterly net income of US$30 million after a prior year loss, are particularly relevant to this technical breakout. They provide some fundamental backing to the improved earnings outlook that has accompanied the golden cross, and give investors a clearer yardstick for judging whether O-I’s Fit to Win cost initiatives are translating into sustainable bottom line progress, rather than just short term margin repair.
Yet investors should also recognize that prolonged volume weakness in Europe could still weigh on O-I Glass’ margins and long term competitiveness if...
O-I Glass’ narrative projects $6.8 billion revenue and $385.1 million earnings by 2028.
Uncover how O-I Glass' forecasts yield a $15.89 fair value, a 7% upside to its current price.
Two fair value estimates from the Simply Wall St Community span roughly US$15.89 to US$49.28 per share, showing how far apart individual views can be. When you set that against the recent golden cross and upgraded earnings forecasts, it underlines why checking several perspectives on O-I Glass’ cost reliant turnaround story matters for understanding the company’s future performance.
Explore 2 other fair value estimates on O-I Glass - why the stock might be worth just $15.89!
Disagree with existing narratives? Create your own in under 3 minutes - extraordinary investment returns rarely come from following the herd.
The market won't wait. These fast-moving stocks are hot now. Grab the list before they run:
This article by Simply Wall St is general in nature. We provide commentary based on historical data and analyst forecasts only using an unbiased methodology and our articles are not intended to be financial advice. It does not constitute a recommendation to buy or sell any stock, and does not take account of your objectives, or your financial situation. We aim to bring you long-term focused analysis driven by fundamental data. Note that our analysis may not factor in the latest price-sensitive company announcements or qualitative material. Simply Wall St has no position in any stocks mentioned.
