How Nelnet’s Dividend Hike and Buybacks At Nelnet (NNI) Has Changed Its Investment Story
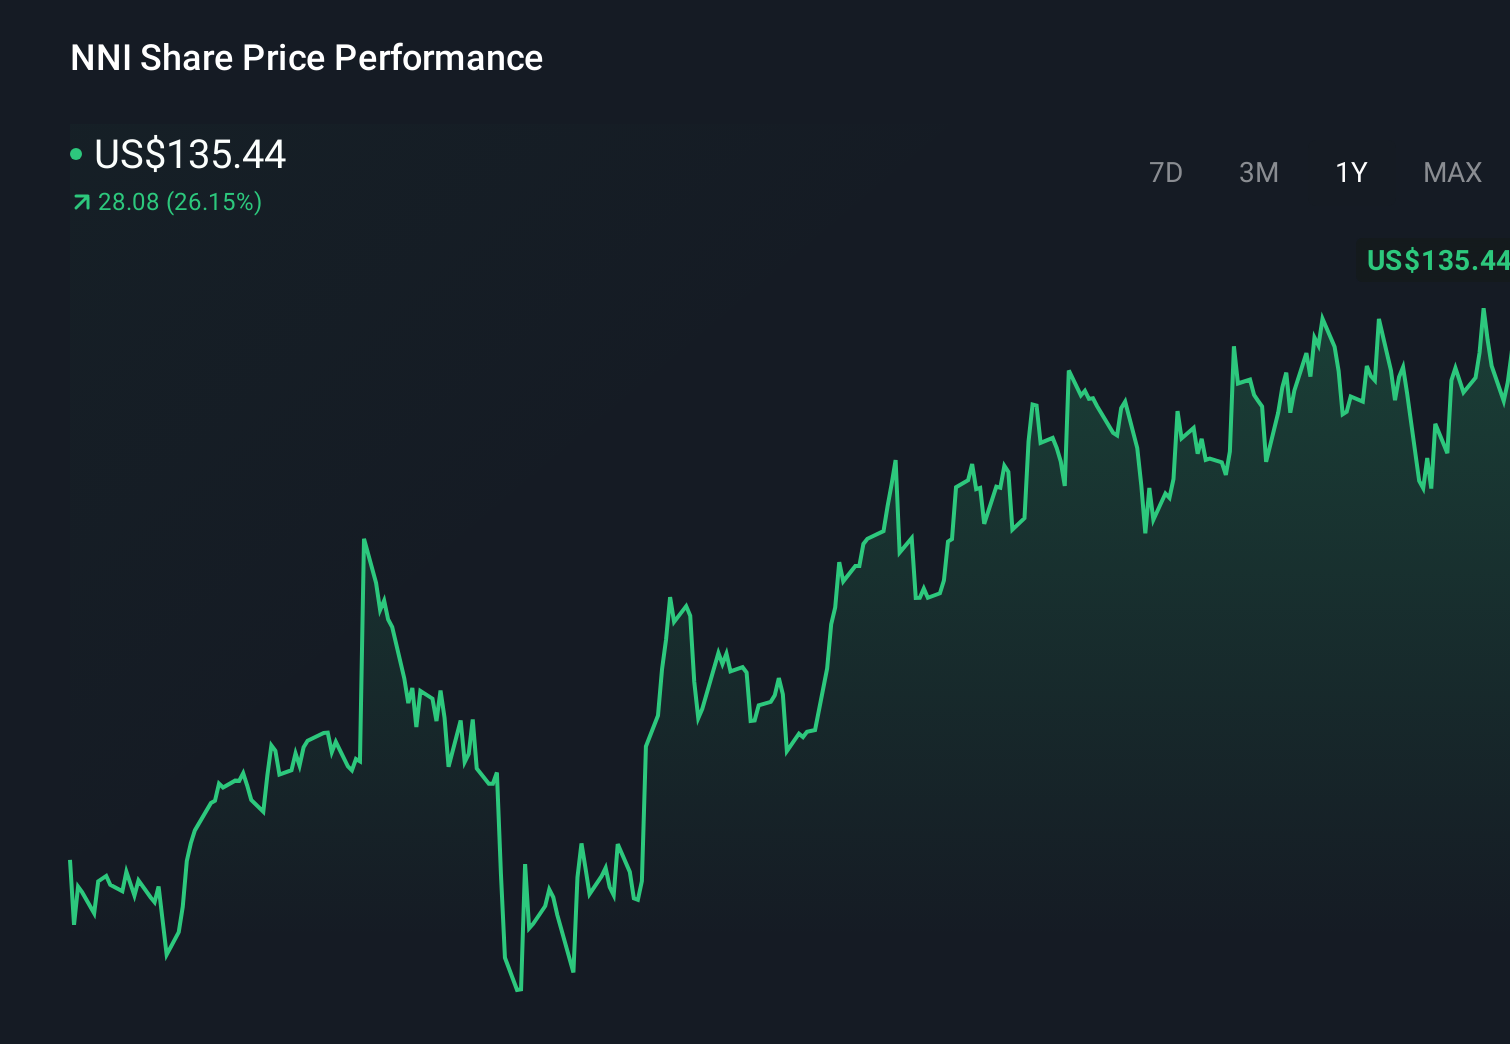
Nelnet, Inc. Class A NNI | 0.00 |
- Nelnet, Inc. recently declared a first-quarter cash dividend of US$0.33 per share on its Class A and Class B common stock, payable on March 13, 2026, to shareholders of record as of February 27, 2026.
- This dividend decision comes alongside 18% annual revenue growth over the past two years, sustained share buybacks, and a return on equity of 10.7%, highlighting a multifaceted approach to rewarding shareholders.
- Next, we will examine how Nelnet’s combination of robust revenue growth and ongoing share repurchases influences the company’s broader investment narrative.
Trump has pledged to "unleash" American oil and gas and these 22 US stocks have developments that are poised to benefit.
What Is Nelnet's Investment Narrative?
To own Nelnet, you need to be comfortable with a story built around disciplined capital allocation, rather than fast top line expansion. Revenue is only expected to grow modestly while earnings are forecast to ease, so the appeal rests on how effectively management converts a mature, diversified business into cash returns through dividends and buybacks. The newly affirmed US$0.33 quarterly dividend, alongside ongoing repurchases and a return on equity in the low double digits, reinforces that income and capital return remain near term catalysts rather than dramatic operational shifts. At the same time, debt coverage by operating cash flow and the risk of earnings slippage leave little room for missteps if conditions tighten. The dividend announcement itself does not materially change these core risks, but it does underline management’s commitment to shareholder payouts in the current setup.
However, there is an important cash flow risk that investors should not overlook. Nelnet's shares are on the way up, but could they be overextended? Uncover how much higher they are than fair value.Exploring Other Perspectives
Fair value estimates from 2 Simply Wall St Community members span roughly US$23 to US$140 per share, reflecting sharply different views on where Nelnet should trade. Set against a business where earnings are projected to drift lower and dividends play a central role in the story, this spread underlines how differently others are weighing the trade off between income, risk and slower growth. You are seeing a wide spectrum of expectations, which can be useful context as you compare your own view with the rest of the market.
Explore 2 other fair value estimates on Nelnet - why the stock might be worth less than half the current price!
Build Your Own Nelnet Narrative
Disagree with this assessment? Create your own narrative in under 3 minutes - extraordinary investment returns rarely come from following the herd.
- A great starting point for your Nelnet research is our analysis highlighting 2 key rewards and 2 important warning signs that could impact your investment decision.
- Our free Nelnet research report provides a comprehensive fundamental analysis summarized in a single visual - the Snowflake - making it easy to evaluate Nelnet's overall financial health at a glance.
No Opportunity In Nelnet?
Markets shift fast. These stocks won't stay hidden for long. Get the list while it matters:
- Rare earth metals are the new gold rush. Find out which 32 stocks are leading the charge.
- We've found 14 US stocks that are forecast to pay a dividend yield of over 6% next year. See the full list for free.
- This technology could replace computers: discover 22 stocks that are working to make quantum computing a reality.
This article by Simply Wall St is general in nature. We provide commentary based on historical data and analyst forecasts only using an unbiased methodology and our articles are not intended to be financial advice. It does not constitute a recommendation to buy or sell any stock, and does not take account of your objectives, or your financial situation. We aim to bring you long-term focused analysis driven by fundamental data. Note that our analysis may not factor in the latest price-sensitive company announcements or qualitative material. Simply Wall St has no position in any stocks mentioned.