How Rising Net Income And Dividend Move At Interactive Brokers Group (IBKR) Has Changed Its Investment Story
Interactive Brokers Group, Inc. Class A IBKR | 68.11 | -0.74% |
- Interactive Brokers Group recently reported past fourth-quarter 2025 net income of US$284 million and full-year net income of US$984 million, alongside declaring a quarterly cash dividend of US$0.08 per share payable on March 13, 2026, to shareholders of record on February 27, 2026.
- The combination of higher earnings per share and continued account and client asset growth highlights how Interactive Brokers is converting increased platform activity into stronger profitability.
- Next, we’ll explore how this earnings momentum, underpinned by rising net income, may influence Interactive Brokers Group’s broader investment narrative.
AI is about to change healthcare. These 112 stocks are working on everything from early diagnostics to drug discovery. The best part - they are all under $10b in market cap - there's still time to get in early.
What Is Interactive Brokers Group's Investment Narrative?
To own Interactive Brokers Group, you need to be comfortable with a story built on scale, technology and active trading volumes, rather than a rich dividend stream. The latest Q4 and full-year 2025 results, with net income up to US$284 million for the quarter and US$984 million for the year, reinforce that the near term catalysts still sit around account growth, client assets and trading activity translating into earnings. The reaffirmed US$0.08 quarterly dividend adds a modest income component but does not materially shift the thesis. What does change a little is the risk balance: strong recent performance and a price sitting not far from consensus targets, combined with a premium P/E multiple and recent insider selling, make valuation discipline and sentiment shifts more important to watch after this earnings beat.
However, one risk in particular may surprise investors who only look at the recent results. Interactive Brokers Group's share price has been on the slide but might be dropping deeper into value territory. Find out whether it's a bargain at this price.Exploring Other Perspectives
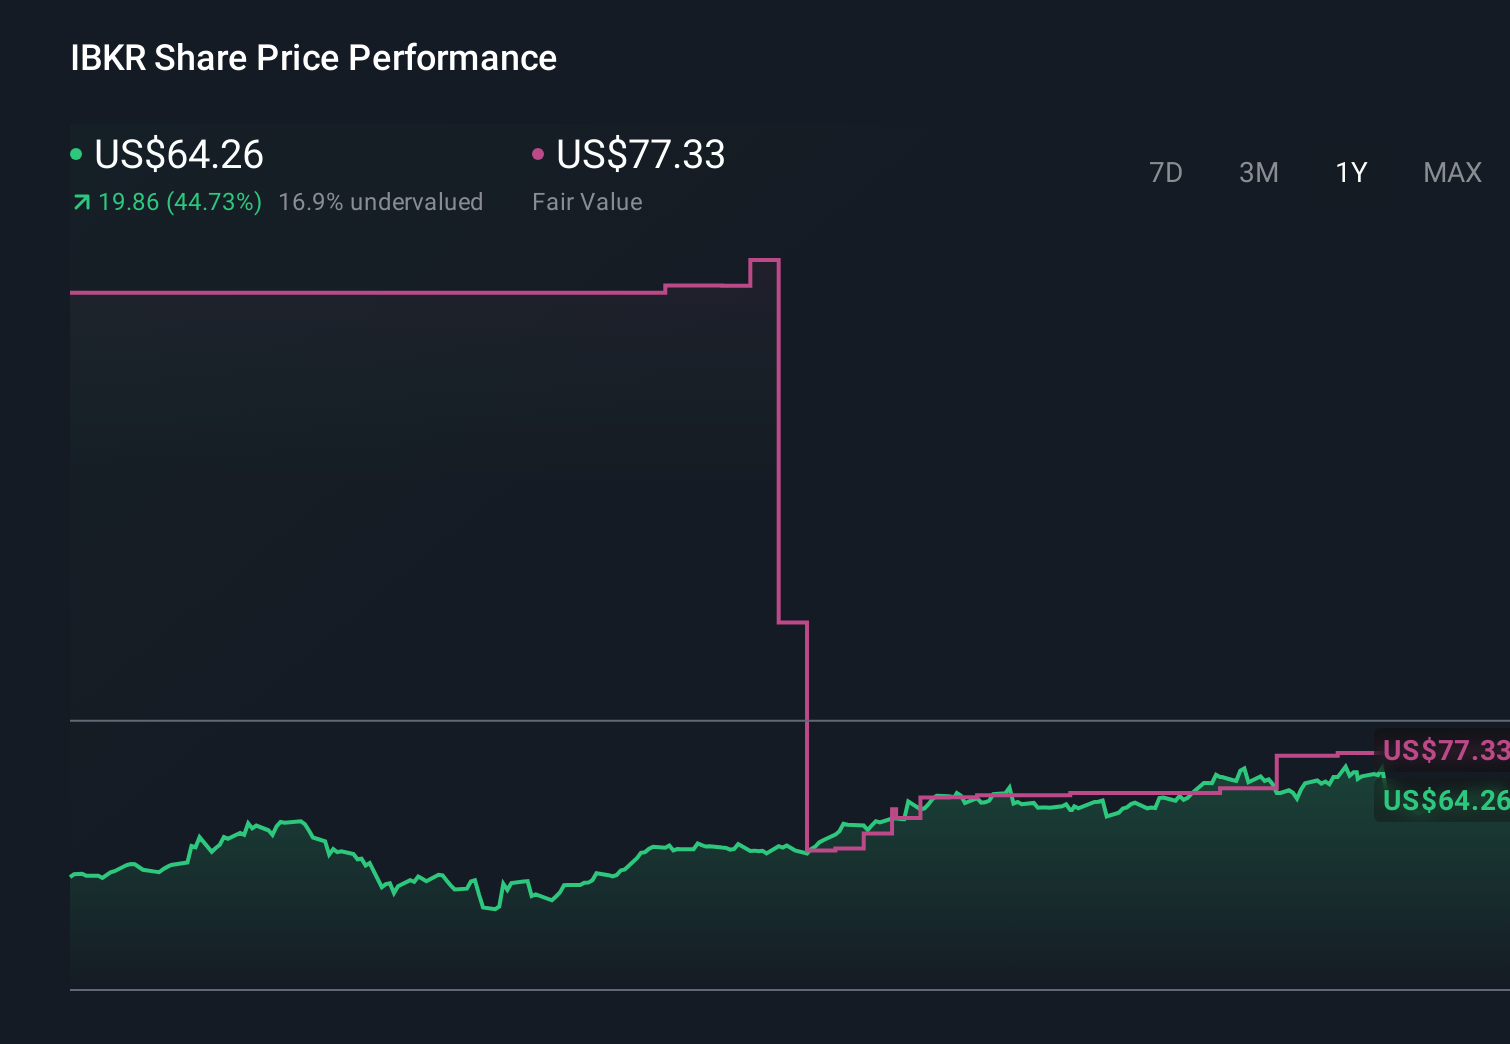
Explore 13 other fair value estimates on Interactive Brokers Group - why the stock might be worth less than half the current price!
Build Your Own Interactive Brokers Group Narrative
Disagree with this assessment? Create your own narrative in under 3 minutes - extraordinary investment returns rarely come from following the herd.
- A great starting point for your Interactive Brokers Group research is our analysis highlighting 2 key rewards and 1 important warning sign that could impact your investment decision.
- Our free Interactive Brokers Group research report provides a comprehensive fundamental analysis summarized in a single visual - the Snowflake - making it easy to evaluate Interactive Brokers Group's overall financial health at a glance.
Looking For Alternative Opportunities?
These stocks are moving-our analysis flagged them today. Act fast before the price catches up:
- The best AI stocks today may lie beyond giants like Nvidia and Microsoft. Find the next big opportunity with these 24 smaller AI-focused companies with strong growth potential through early-stage innovation in machine learning, automation, and data intelligence that could fund your retirement.
- These 14 companies survived and thrived after COVID and have the right ingredients to survive Trump's tariffs. Discover why before your portfolio feels the trade war pinch.
- The latest GPUs need a type of rare earth metal called Neodymium and there are only 30 companies in the world exploring or producing it. Find the list for free.
This article by Simply Wall St is general in nature. We provide commentary based on historical data and analyst forecasts only using an unbiased methodology and our articles are not intended to be financial advice. It does not constitute a recommendation to buy or sell any stock, and does not take account of your objectives, or your financial situation. We aim to bring you long-term focused analysis driven by fundamental data. Note that our analysis may not factor in the latest price-sensitive company announcements or qualitative material. Simply Wall St has no position in any stocks mentioned.