
Please use a PC Browser to access Register-Tadawul
Get It
In One Chart | Costco (COST) Shares up 50% YTD, and Q1 Results Explained Why
Costco Wholesale Corporation COST | 884.47 | 0.00% |
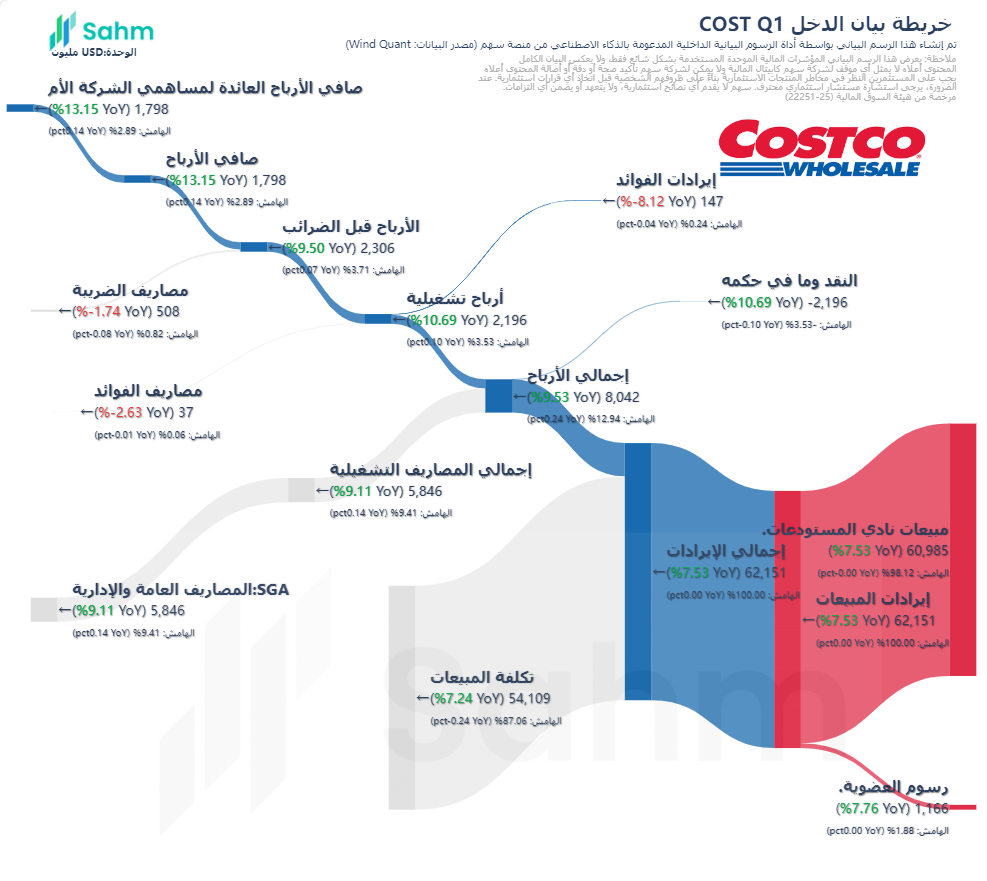
Costco Wholesale Corporation(COST.US) released its financial results for the first quarter of fiscal year 2025 on December 13. The company reported a 13.15% increase in net profit for the quarter, driven by strong sales and membership renewals.
For Q1 FY2025, Costco recorded revenue of US$62.151 billion, a 7.53% increase from US$57.799 billion in the same quarter last year. Net profit for the quarter rose to US$1.798 billion, up from US$1.589 billion a year earlier. Basic earnings per share were US$4.05, compared to US$3.58 in Q1 FY2024.
Costco operates in the retail industry, focusing on consumer staples, and its business model includes membership warehouse operations in the US, Puerto Rico, Canada, the UK, Mexico, Japan, South Korea, Australia, Spain, France, Iceland, and China. The company aims to offer selected national and private-label products at low prices to generate high sales volumes and rapid inventory turnover.
Key Financial Highlights:
- Revenue: US$62.151 billion, up 7.53% year-over-year.
- Net Profit: US$1.798 billion, up 13.15% year-over-year.
- Basic EPS: US$4.05, up from US$3.58 in the same period last year.
Costco also reported an increase in its membership base, with approximately 90% of existing members renewing their memberships. While shopper traffic increased in comparable stores, the number of transactions remained flat.
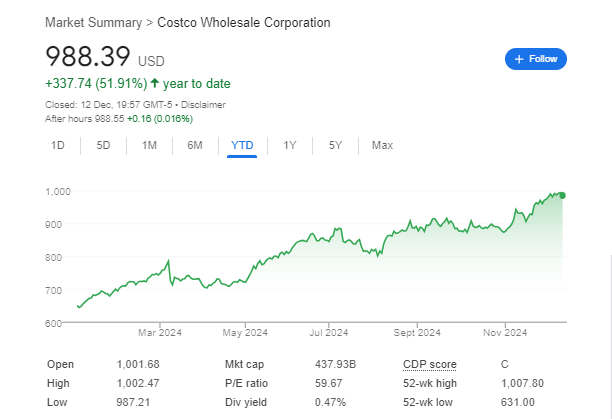
The company's financial performance exceeded analysts' expectations, supported by growing membership numbers and stable operational efficiency. Costco's stock has risen 50% year-to-date as of Thursday's close.
| Costco Wholesale Corporation(COST.US) - GSD. Income Statement (Single Quarter) (Unit: million, USD) | 2024-11-24 | 2023-11-26 |
| Reporting Period | Q1 | Q1 |
| Report Type | Consolidated | Consolidated |
| Total Revenue | 62,151.000 | 57,799.000 |
| Main Business Income | 62,151.000 | 57,799.000 |
| Total Operating Expenses | 59,955.000 | 55,815.000 |
| Operating Costs | 54,109.000 | 50,457.000 |
| Operating Expenses | 5,846.000 | 5,358.000 |
| Operating Profit | 2,196.000 | 1,984.000 |
| Add: Interest Income | 147.000 | 160.000 |
| Minus: Interest Expenses | 37.000 | 38.000 |
| Profit Before Extraordinary Items | 2,306.000 | 2,106.000 |
| Profit Before Tax | 2,306.000 | 2,106.000 |
| Minus: Income Tax | 508.000 | 517.000 |
| Net Profit from Continuing Operations | 1,798.000 | 1,589.000 |
| Net Profit | 1,798.000 | 1,589.000 |
| Net Profit attributable to Ordinary Shareholders | 1,798.000 | 1,589.000 |
| Costco Wholesale Corporation(COST.US) - Main Business Composition (by Indicator. Single Quarter) (Unit: million, USD) | 2024-11-24 | 2023-11-26 |
| Reporting Period | Q1 | Q1 |
| Report Type | Consolidated | Consolidated |
| Operating Income | 62,151.000 | 57,799.000 |
| Products | 62,151.000 | 57,799.000 |
| Warehouse and Hypermarket Sales | 60,985.000 | 56,717.000 |
| Membership Fees | 1,166.000 | 1,082.000 |
| Operating Costs | 54,109.000 | 50,457.000 |
| Gross Profit | 8,042.000 | 7,342.000 |
| Gross Profit Rate (%) | 12.94 | 12.70 |
