
Please use a PC Browser to access Register-Tadawul
Get It
Individual investors invested in PSQ Holdings, Inc. (NYSE:PSQH) up 17% last week, insiders too were rewarded
PSQ Holdings, Inc. Class A Common Stock PSQH | 1.29 1.30 | -0.77% +0.72% Pre |
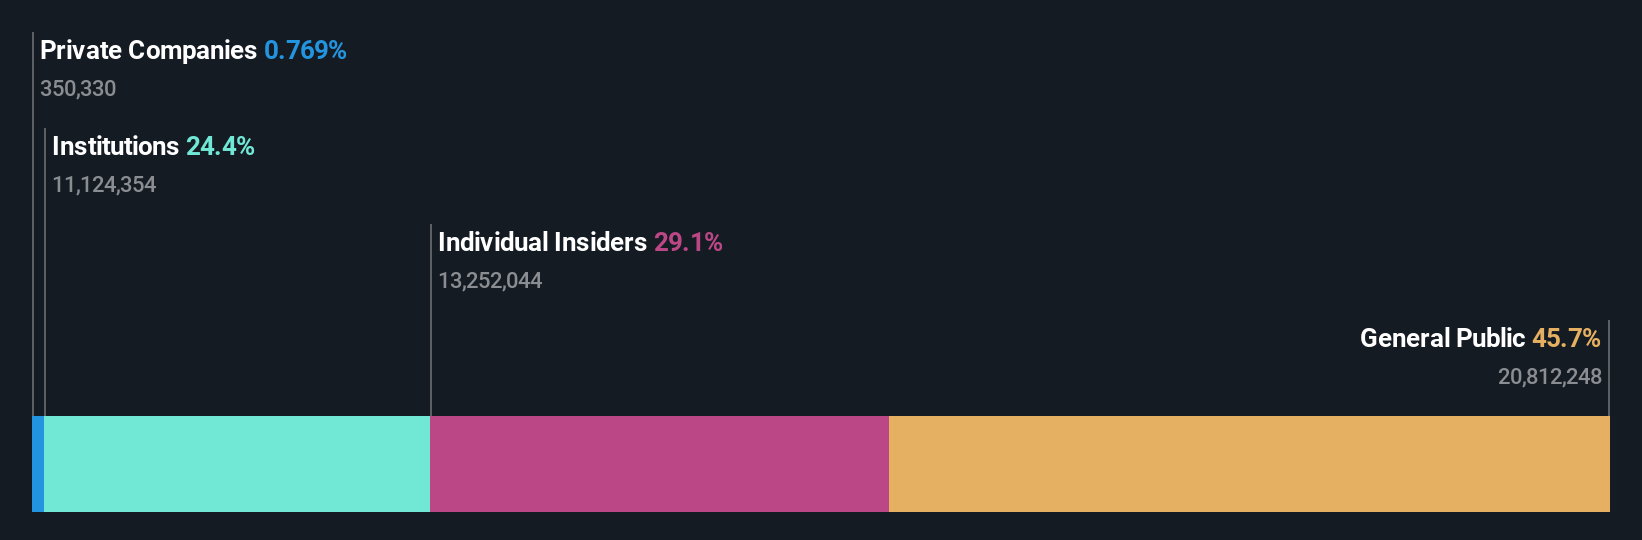
If you want to know who really controls PSQ Holdings, Inc. (NYSE:PSQH), then you'll have to look at the makeup of its share registry. The group holding the most number of shares in the company, around 46% to be precise, is individual investors. In other words, the group stands to gain the most (or lose the most) from their investment into the company.
While individual investors were the group that benefitted the most from last week’s US$17m market cap gain, insiders too had a 29% share in those profits.
Let's take a closer look to see what the different types of shareholders can tell us about PSQ Holdings.
Institutional investors commonly compare their own returns to the returns of a commonly followed index. So they generally do consider buying larger companies that are included in the relevant benchmark index.
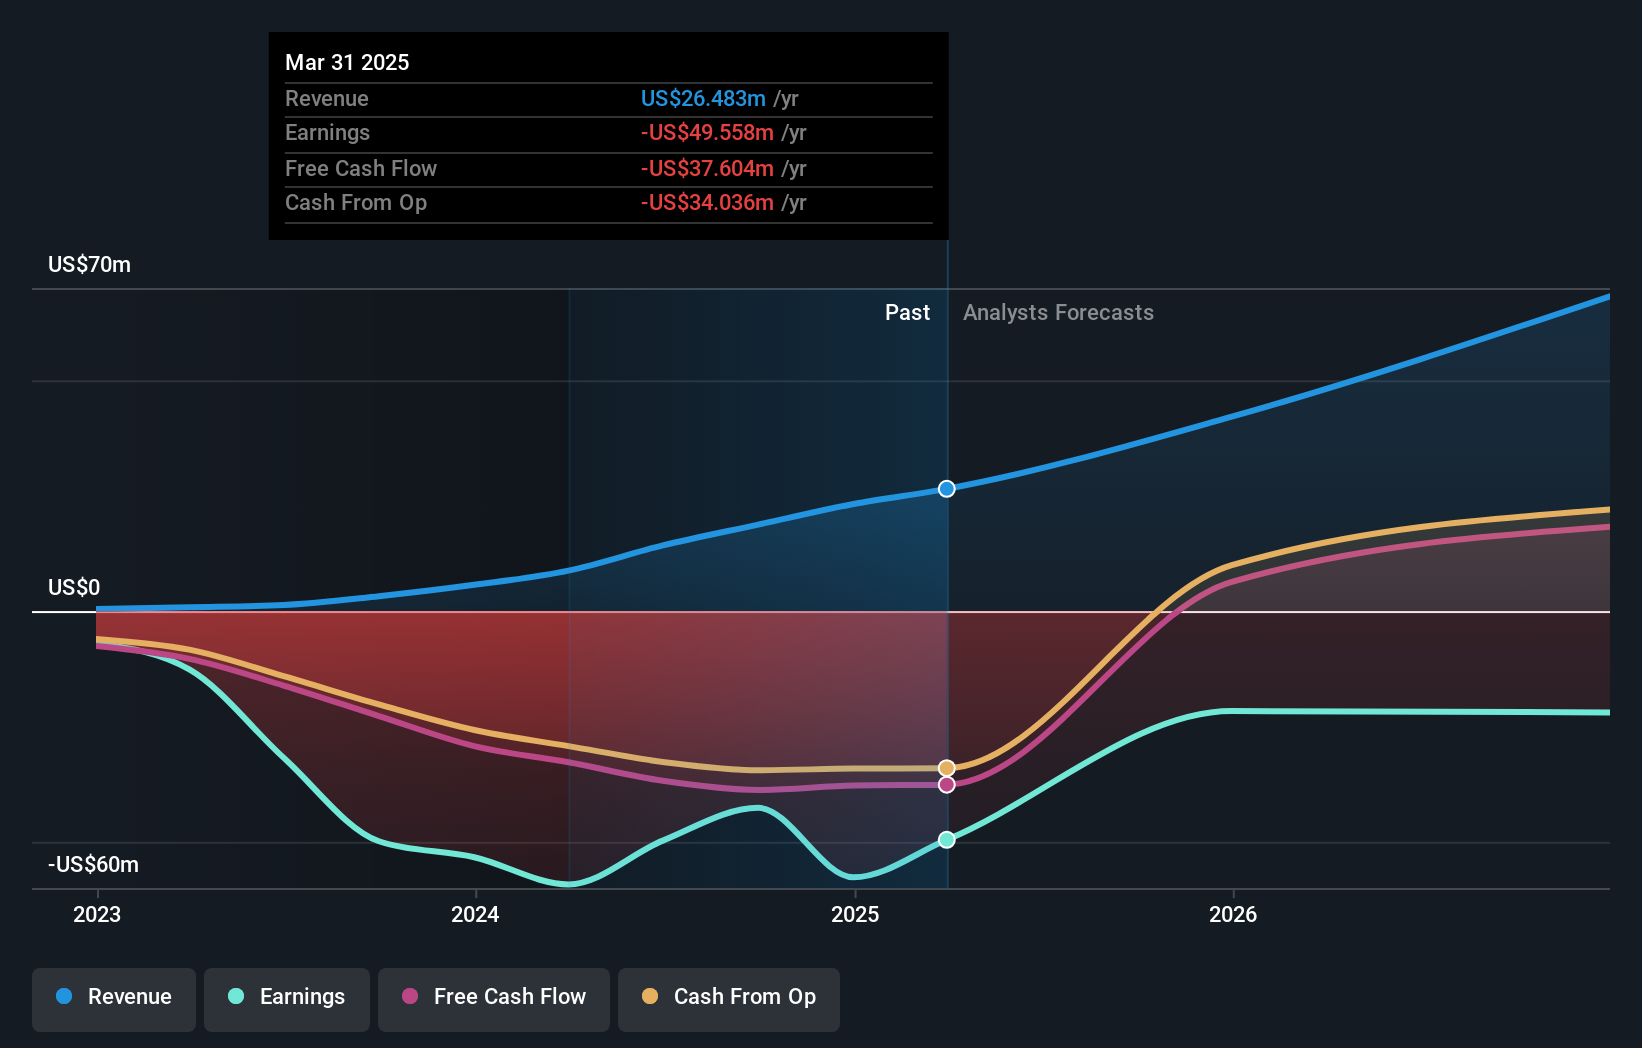
PSQ Holdings already has institutions on the share registry. Indeed, they own a respectable stake in the company. This suggests some credibility amongst professional investors. But we can't rely on that fact alone since institutions make bad investments sometimes, just like everyone does. If multiple institutions change their view on a stock at the same time, you could see the share price drop fast. It's therefore worth looking at PSQ Holdings' earnings history below. Of course, the future is what really matters.
PSQ Holdings is not owned by hedge funds. The company's CEO Michael Seifert is the largest shareholder with 11% of shares outstanding. Meanwhile, the second and third largest shareholders, hold 5.0% and 4.3%, of the shares outstanding, respectively.
A closer look at our ownership figures suggests that the top 25 shareholders have a combined ownership of 50% implying that no single shareholder has a majority.
While it makes sense to study institutional ownership data for a company, it also makes sense to study analyst sentiments to know which way the wind is blowing. There is some analyst coverage of the stock, but it could still become more well known, with time.
The definition of an insider can differ slightly between different countries, but members of the board of directors always count. Management ultimately answers to the board. However, it is not uncommon for managers to be executive board members, especially if they are a founder or the CEO.
Insider ownership is positive when it signals leadership are thinking like the true owners of the company. However, high insider ownership can also give immense power to a small group within the company. This can be negative in some circumstances.
It seems insiders own a significant proportion of PSQ Holdings, Inc.. Insiders have a US$31m stake in this US$105m business. It is great to see insiders so invested in the business. It might be worth checking if those insiders have been buying recently.
The general public-- including retail investors -- own 46% stake in the company, and hence can't easily be ignored. While this group can't necessarily call the shots, it can certainly have a real influence on how the company is run.
I find it very interesting to look at who exactly owns a company. But to truly gain insight, we need to consider other information, too. Like risks, for instance.
But ultimately it is the future, not the past, that will determine how well the owners of this business will do. Therefore we think it advisable to take a look at this free report showing whether analysts are predicting a brighter future.
NB: Figures in this article are calculated using data from the last twelve months, which refer to the 12-month period ending on the last date of the month the financial statement is dated. This may not be consistent with full year annual report figures.
This article by Simply Wall St is general in nature. We provide commentary based on historical data and analyst forecasts only using an unbiased methodology and our articles are not intended to be financial advice. It does not constitute a recommendation to buy or sell any stock, and does not take account of your objectives, or your financial situation. We aim to bring you long-term focused analysis driven by fundamental data. Note that our analysis may not factor in the latest price-sensitive company announcements or qualitative material. Simply Wall St has no position in any stocks mentioned.
