Interactive Brokers Group (IBKR) closed out FY 2025 with Q4 total revenue of US$1.7b and basic EPS of US$0.64, alongside net income of US$284m, setting a clear reference point for the year just finished. The company has seen quarterly revenue move from US$1.4b in Q1 2025 to US$1.7b in Q4 2025, while basic EPS has ranged from US$0.49 in Q1 to US$0.64 in Q4, providing a clear view of how the top and bottom line have tracked through the year as you weigh the latest print against the trailing 12 month figures. With a trailing net margin assessed at 15.9% versus 14.5% a year earlier and earnings quality described as high, this set of results places profitability at the center of the story for investors.
See our full analysis for Interactive Brokers Group.
With the numbers on the table, the next step is to see how this earnings run rate aligns with the widely followed narratives around Interactive Brokers, highlighting where the data supports the story and where expectations may need adjusting.
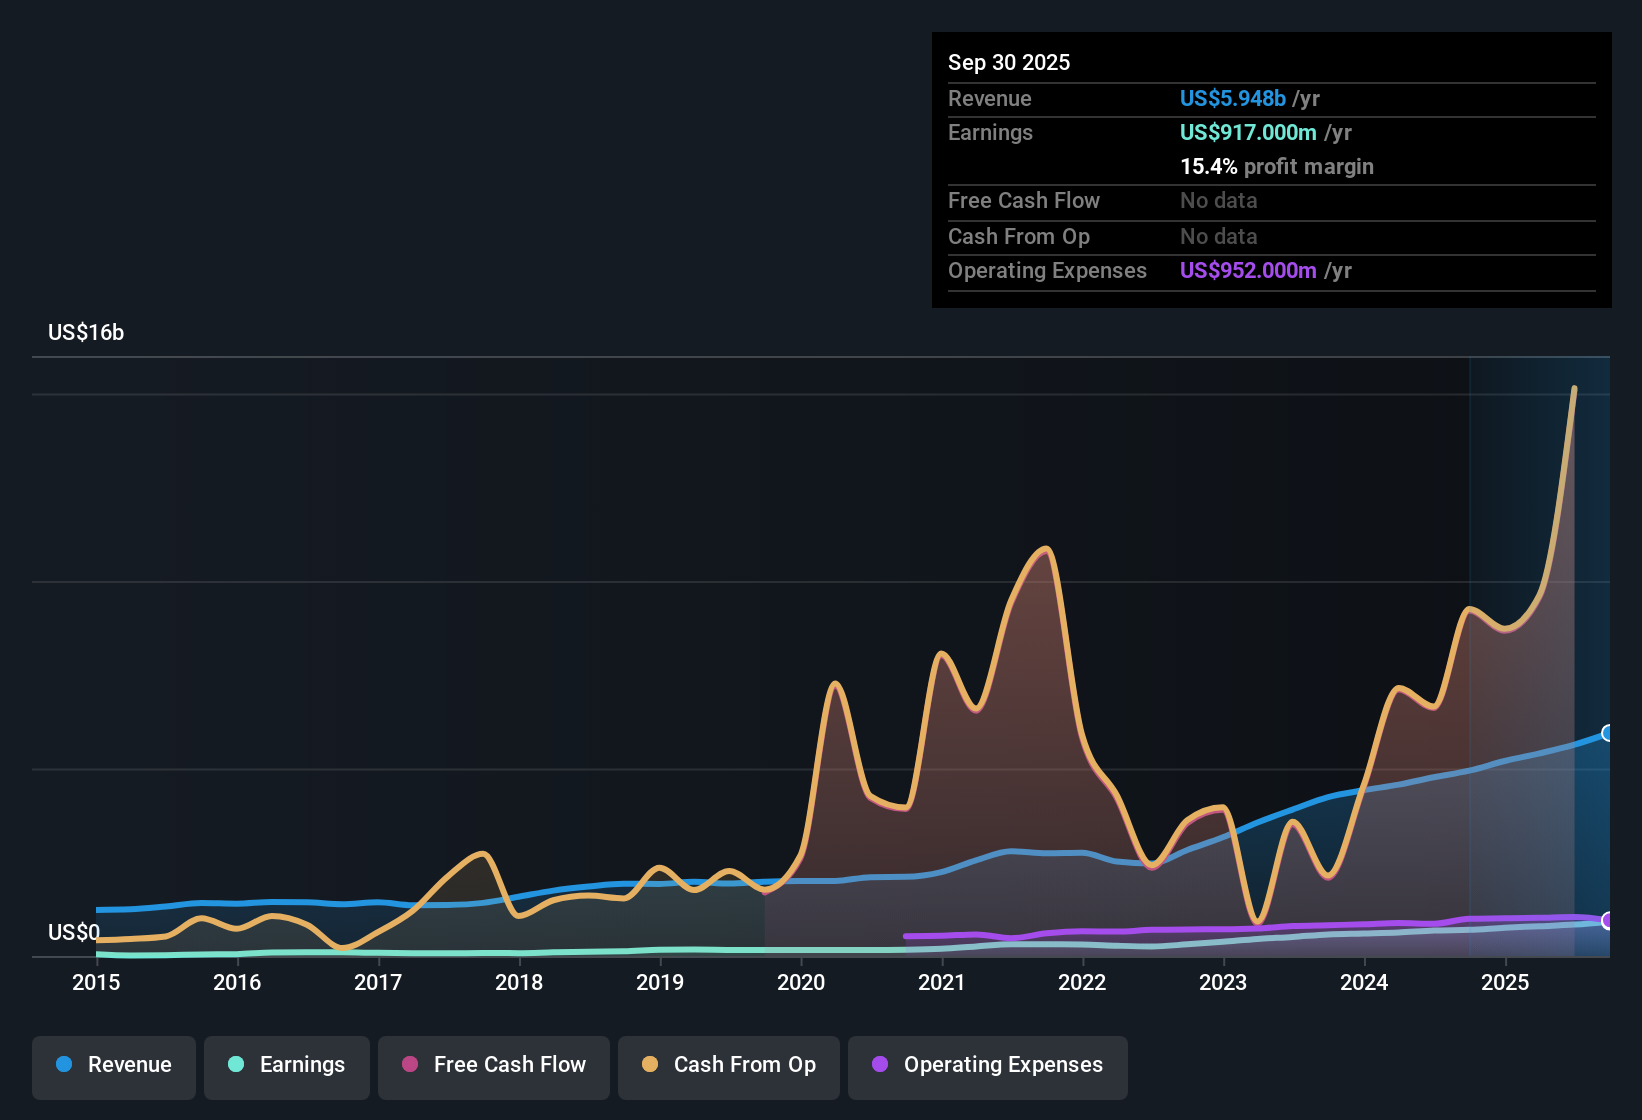
NasdaqGS:IBKR Earnings & Revenue History as at Jan 2026
30.3% Earnings Growth Sets The Backdrop
Over the last 12 months, earnings grew 30.3% to US$984 million on US$6.2b of trailing revenue, with basic EPS for the trailing period at US$2.23.
For investors taking a bullish view, this 30.3% earnings growth and a five year average of 29.1% growth sit alongside a trailing net margin of 15.9%. At the same time, forecasts point to slower earnings growth of about 11.5% per year and revenue growth of about 8.4% per year, which creates a gap between strong recent delivery and more moderate expectations.
Supporters can point to the US$6.2b in trailing revenue and US$984 million of net income as evidence that the business has been able to turn scale into profits.
The shift from 30.3% historical earnings growth to forecast 11.5% growth means anyone leaning on a bullish narrative has to reconcile that slowdown with their view of what comes next.
To see how this growth track record lines up with the broader story around Interactive Brokers, take a closer look at the balanced narrative some investors are building around these numbers.
📊 Read the full Interactive Brokers Group Consensus Narrative.
Margins Hold Near 16% As Revenue Builds
The trailing net margin sits at 15.9%, compared with 14.5% a year ago, on trailing twelve month revenue of about US$6.2b and net income of US$984 million. This gives you a sense of how much profit is being kept from each dollar of revenue.
Analysts who lean bullish often focus on this margin profile, since a move from 14.5% to 15.9% has come alongside quarterly revenue stepping from US$1.4b in Q1 2025 to US$1.7b in Q4 2025. However, the same data set also reminds you that even with high quality earnings, future growth forecasts of 11.5% for earnings and 8.4% for revenue are lower than the US market figures cited, which tempers how aggressively that margin strength can be interpreted.
The pattern of quarterly net income from US$213 million in Q1 2025 to US$284 million in Q4 2025 lines up with the margin improvement and supports the idea that profitability has been solid across the year.
With those forward growth rates sitting below the referenced US market forecasts of 16.1% for earnings and 10.6% for revenue, the margin story exists alongside more measured growth assumptions rather than open ended expansion.
Rich 34.3x P/E Versus DCF Value
The shares trade on a trailing P/E of 34.3x at a current price of US$75.80, while the DCF fair value cited is US$38.47, and peer or industry P/E levels are around 25x. This sets up a clear valuation gap for you to be aware of.
Critics with a bearish tilt often point to this higher 34.3x multiple and the premium over the US$38.47 DCF fair value as signs that the stock is sensitive to any change in the growth story. This is especially relevant because forecast earnings growth of 11.5% per year and revenue growth of 8.4% per year are already below the cited US market averages, which means the valuation is leaning more on the quality of the business than on faster growth than the market.
The contrast between the US$75.80 share price and the DCF fair value of US$38.47 quantifies how far the market price sits above that cash flow based estimate.
Stacking the 34.3x P/E against peer and industry numbers near 25x underlines why valuation is framed as a key risk in the analysis rather than just a side issue.
Next Steps
Don't just look at this quarter; the real story is in the long-term trend. We've done an in-depth analysis on Interactive Brokers Group's growth and its valuation to see if today's price is a bargain. Add the company to your watchlist or portfolio now so you don't miss the next big move.
See What Else Is Out There
Interactive Brokers combines solid profitability with forecasts that point to slower earnings and revenue growth than the wider US market, while trading on a richer P/E and above its cited DCF fair value.
If that mix of slower forecast growth and a richer valuation makes you cautious, check out our these 876 undervalued stocks based on cash flows today to focus on companies where pricing looks more aligned with underlying cash flows.
This article by Simply Wall St is general in nature. We provide commentary based on historical data and analyst forecasts only using an unbiased methodology and our articles are not intended to be financial advice. It does not constitute a recommendation to buy or sell any stock, and does not take account of your objectives, or your financial situation. We aim to bring you long-term focused analysis driven by fundamental data. Note that our analysis may not factor in the latest price-sensitive company announcements or qualitative material. Simply Wall St has no position in any stocks mentioned.