
Please use a PC Browser to access Register-Tadawul
Get It
Interactive Brokers (IBKR) Is Up 5.8% After Strong 2025 Earnings And New Stablecoin Funding Options
Interactive Brokers Group, Inc. Class A IBKR | 74.39 | +0.55% |
Uncover the next big thing with financially sound penny stocks that balance risk and reward.
To own Interactive Brokers today, you have to believe in its fully automated, low-cost global brokerage model continuing to pull in assets and active traders, while management keeps tight control of costs. The latest quarter underpins that story: Q4 and full-year 2025 earnings moved higher, client accounts jumped 32% to 4.4 million, and client equity reached roughly US$780 billion, helping justify the share price’s recent run toward analysts’ consensus value around US$80. The new stablecoin funding feature fits neatly into the growth narrative by smoothing cross-border funding and potentially supporting further account and activity growth, but it is unlikely to shift the near-term earnings picture on its own. Instead, the more immediate catalysts and risks still sit with trading activity, net interest income, and a valuation that already embeds a lot of optimism.
However, one risk that investors should be aware of is how much is already priced in. Interactive Brokers Group's shares are on the way up, but could they be overextended? Uncover how much higher they are than fair value.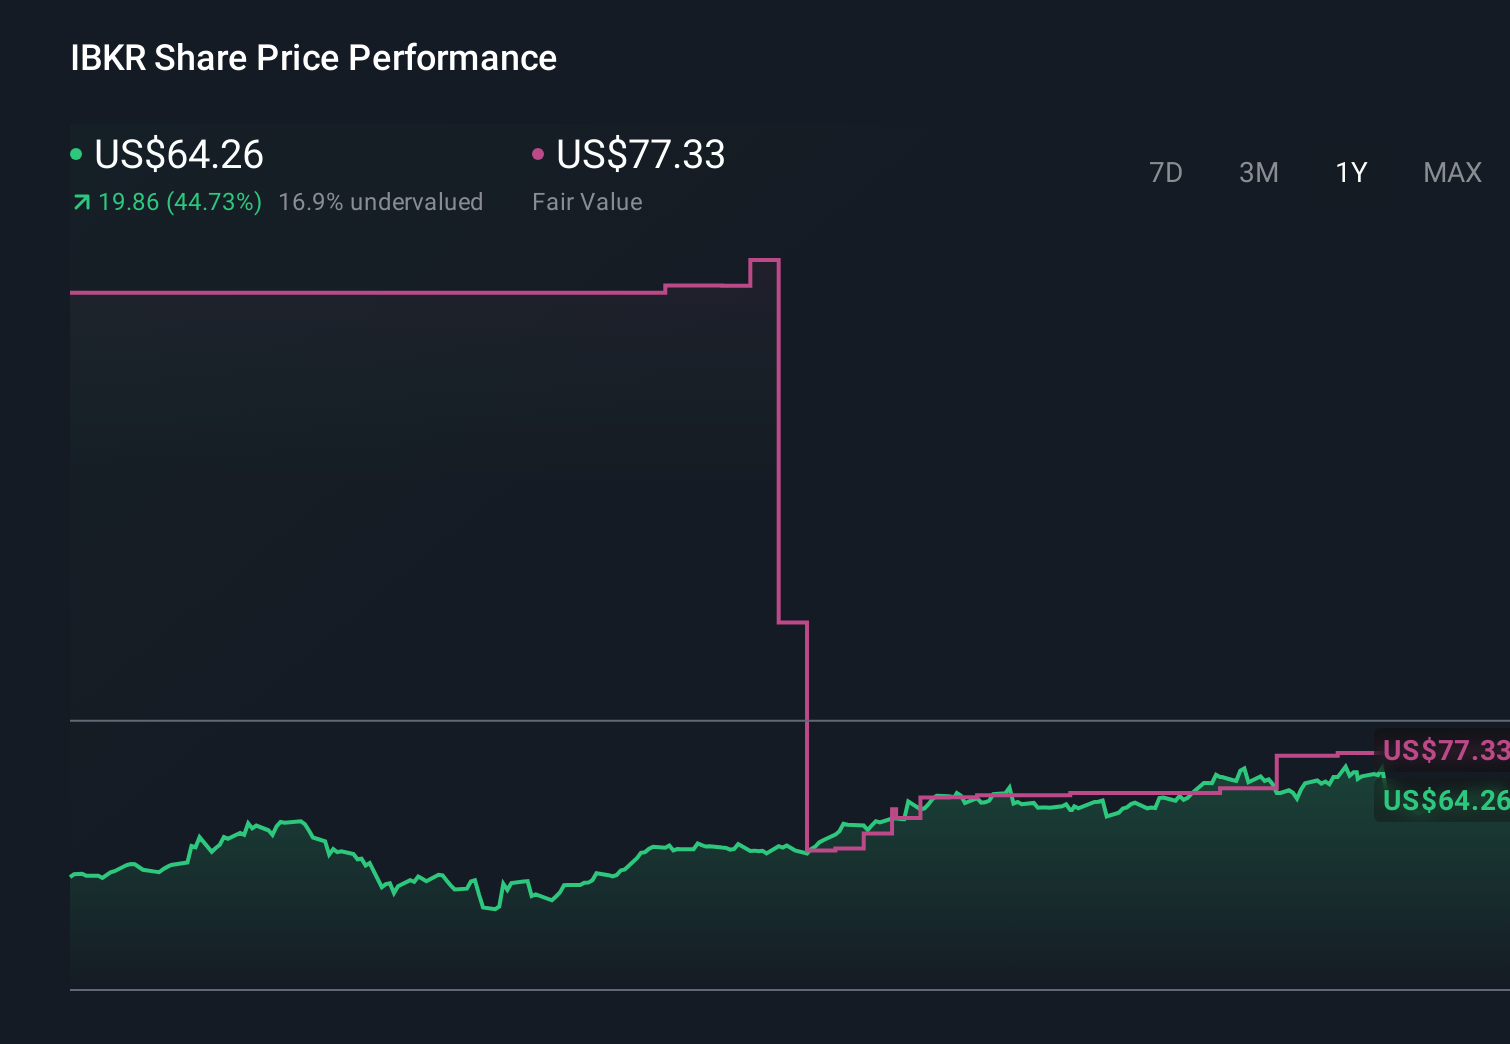
Explore 14 other fair value estimates on Interactive Brokers Group - why the stock might be worth as much as 10% more than the current price!
Disagree with this assessment? Create your own narrative in under 3 minutes - extraordinary investment returns rarely come from following the herd.
Right now could be the best entry point. These picks are fresh from our daily scans. Don't delay:
This article by Simply Wall St is general in nature. We provide commentary based on historical data and analyst forecasts only using an unbiased methodology and our articles are not intended to be financial advice. It does not constitute a recommendation to buy or sell any stock, and does not take account of your objectives, or your financial situation. We aim to bring you long-term focused analysis driven by fundamental data. Note that our analysis may not factor in the latest price-sensitive company announcements or qualitative material. Simply Wall St has no position in any stocks mentioned.
