
Please use a PC Browser to access Register-Tadawul
Get It
Is Aflac (AFL) Attractively Priced After Strong Multi Year Share Price Performance
Aflac Incorporated AFL | 111.29 | +0.23% |
The Excess Returns model looks at how much profit Aflac is expected to earn on its equity above the return that shareholders require, then projects that stream of “extra” value into the future.
For Aflac, the key inputs are:
In simple terms, the model assumes Aflac can earn more on its equity than the required shareholder return, and that this gap, the $4.10 per share excess return, is sustained on a stable equity base of around the mid $50s per share.
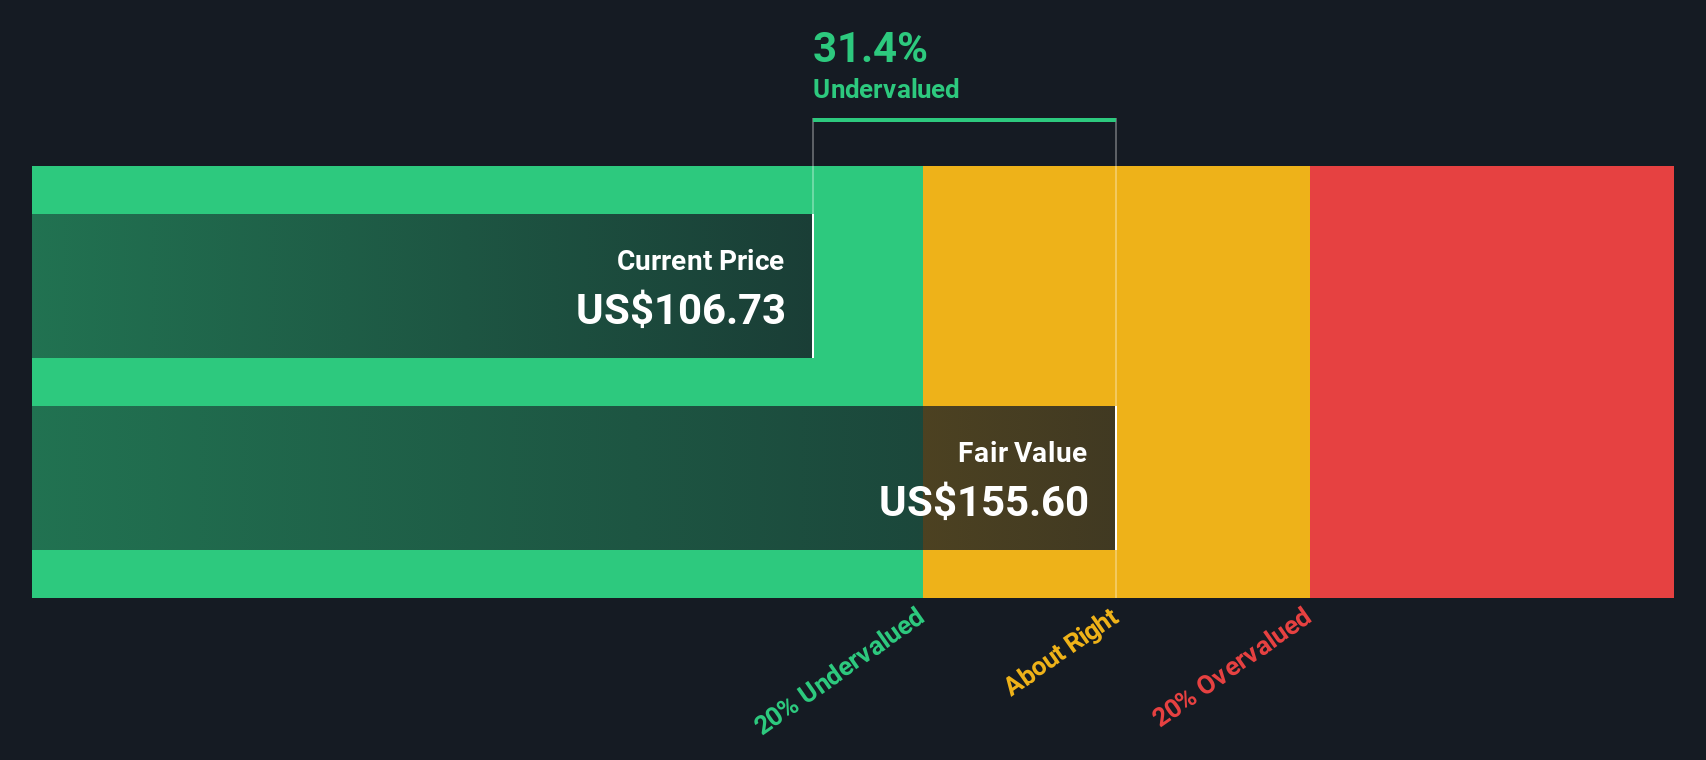
Based on these assumptions, the Excess Returns model arrives at an intrinsic value of about $168.43 per share. Compared with the recent share price of $110.95, this implies the stock is 34.1% undervalued on this approach.
Result: UNDERVALUED
Our Excess Returns analysis suggests Aflac is undervalued by 34.1%. Track this in your watchlist or portfolio, or discover 875 more undervalued stocks based on cash flows.
For a profitable company like Aflac, the P/E ratio is a useful yardstick because it links what you pay per share to the earnings that each share generates. It gives you a quick sense of how much the market is paying for each dollar of current earnings.
What counts as a “normal” P/E ratio tends to move with expectations for growth and risk. Higher expected earnings growth or lower perceived risk can support a higher multiple, while lower growth expectations or higher risk usually justify a lower one.
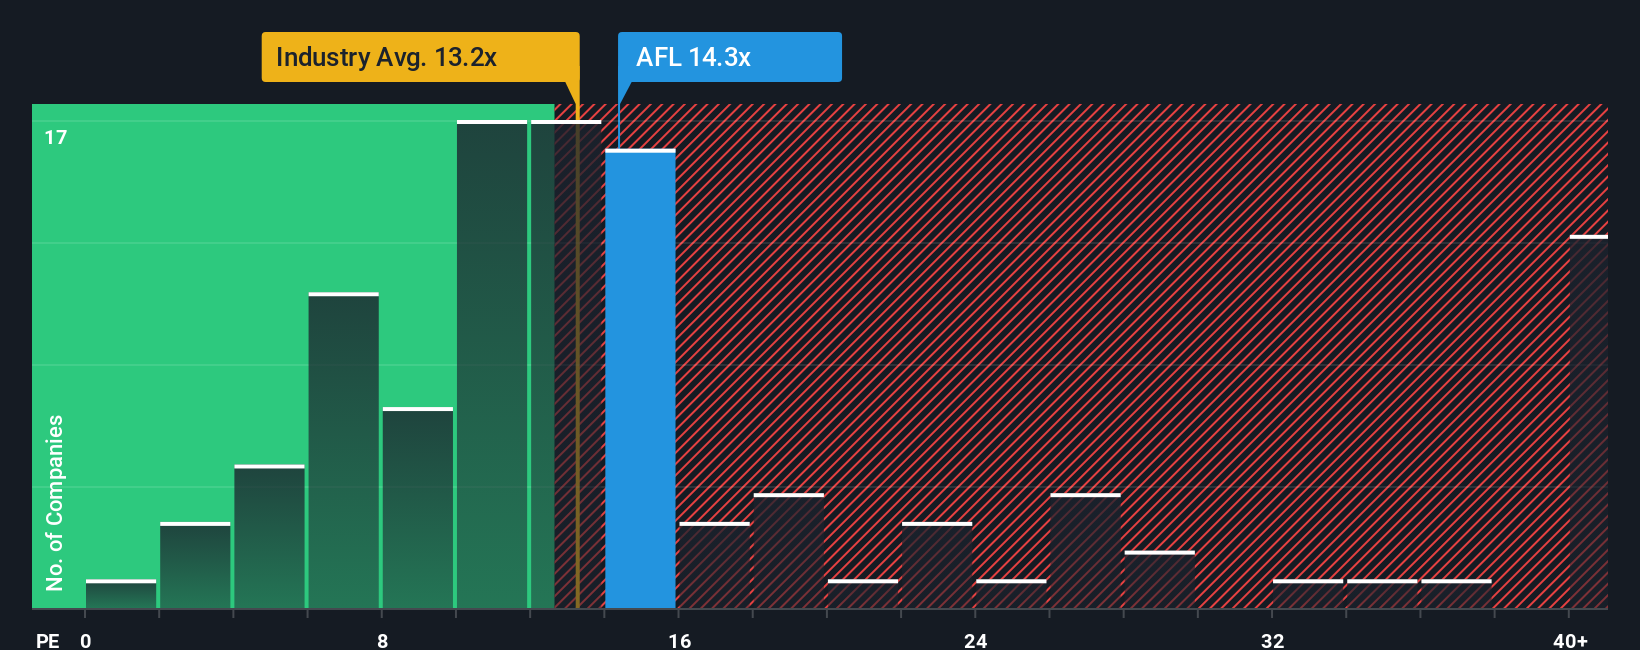
Aflac currently trades on a P/E of 13.95x. That sits close to the Insurance industry average P/E of about 13.22x and the peer average of 14.12x, so the market is pricing Aflac broadly in line with comparable insurers. Simply Wall St’s Fair Ratio for Aflac is 12.58x, which is its proprietary view of what the P/E “should” be after factoring in elements such as earnings growth, profit margins, industry, market cap and risk profile.
This Fair Ratio can be more informative than a simple peer or industry comparison because it is tailored to Aflac’s own fundamentals rather than relying only on group averages. Since Aflac’s actual P/E of 13.95x is above the Fair Ratio of 12.58x by more than a small margin, the shares screen as slightly expensive on this metric.
Result: OVERVALUED
P/E ratios tell one story, but what if the real opportunity lies elsewhere? Discover 1426 companies where insiders are betting big on explosive growth.
Earlier we mentioned that there is an even better way to understand valuation. Let us introduce you to Narratives, which are simply your story about Aflac, linked to your own assumptions for future revenue, earnings, margins and a fair value estimate that you can compare directly with today’s share price.
On Simply Wall St’s Community page, used by millions of investors, Narratives give you an accessible way to connect what you believe about Aflac’s business to a clear financial forecast and an implied fair value per share. This allows you to quickly see whether your view suggests the stock is attractively priced, fully priced or expensive.
Because Narratives update when fresh information arrives, such as new earnings or major news, your fair value view stays aligned with what is happening. You can then use the gap between your Fair Value and the current Price to help decide whether to add, trim or wait.
For example, one Aflac Narrative on the Community page might assume conservative earnings and a lower fair value, while another could assume stronger margins and a higher fair value. This shows how two investors can look at the same company and reach very different price conclusions.
Do you think there's more to the story for Aflac? Head over to our Community to see what others are saying!
This article by Simply Wall St is general in nature. We provide commentary based on historical data and analyst forecasts only using an unbiased methodology and our articles are not intended to be financial advice. It does not constitute a recommendation to buy or sell any stock, and does not take account of your objectives, or your financial situation. We aim to bring you long-term focused analysis driven by fundamental data. Note that our analysis may not factor in the latest price-sensitive company announcements or qualitative material. Simply Wall St has no position in any stocks mentioned.
