
Please use a PC Browser to access Register-Tadawul
Get It
Is Best Buy (BBY) Pricing Look Attractive After Prolonged Share Price Weakness
Best Buy Co.,Inc. BBY | 62.59 | -0.02% |
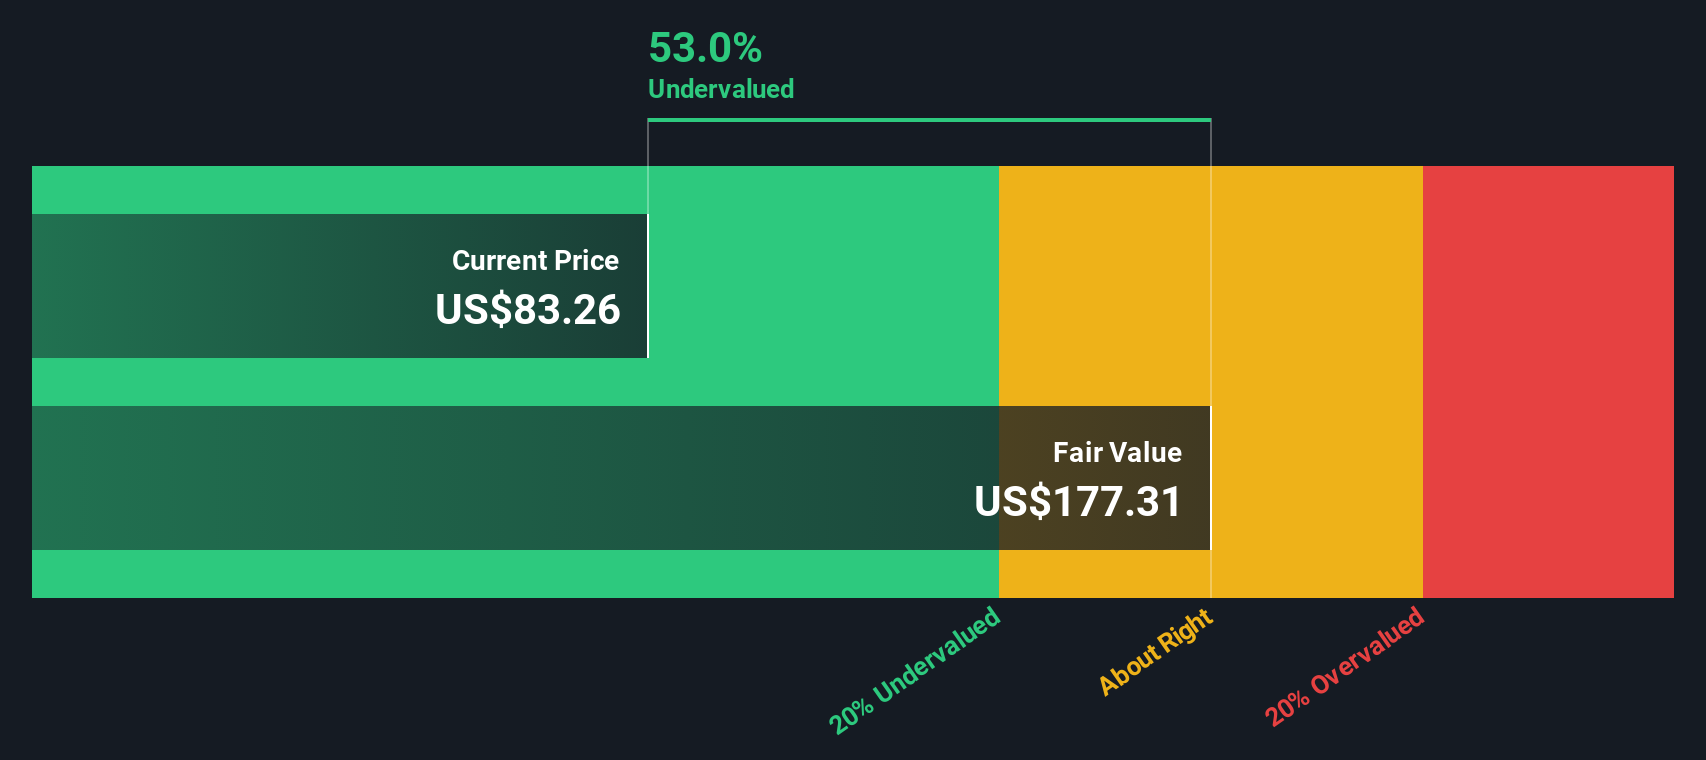
A Discounted Cash Flow, or DCF, model estimates what a company might be worth by projecting its future cash flows and discounting them back to today using a required rate of return. It focuses on cash that could, in theory, be returned to shareholders over time.
For Best Buy, the model uses last twelve month Free Cash Flow of about $1.48b as a starting point. Analysts provide explicit forecasts for several years, and Simply Wall St then extrapolates those out further. On this basis, projected Free Cash Flow for 2035 is about $2.54b, with intermediate annual figures between those two points as set out in the model.
Bringing all those projected cash flows back to today using the 2 Stage Free Cash Flow to Equity method gives an estimated intrinsic value of $147.55 per share. Compared with the recent share price of $65.10, the DCF indicates an implied 55.9% discount. This suggests the market is pricing Best Buy below this cash flow based estimate.
Result: UNDERVALUED
Our Discounted Cash Flow (DCF) analysis suggests Best Buy is undervalued by 55.9%. Track this in your watchlist or portfolio, or discover 875 more undervalued stocks based on cash flows.
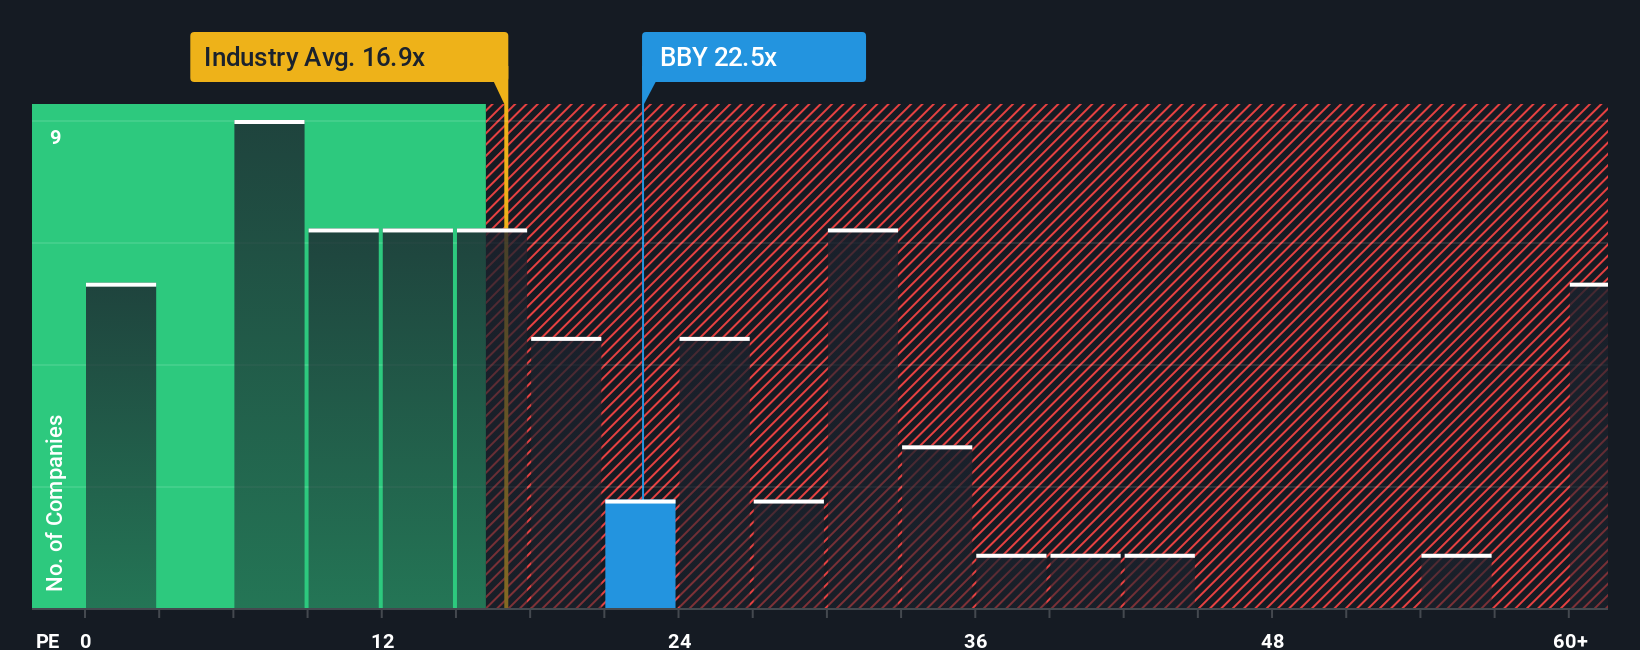
For a profitable company like Best Buy, the P/E ratio is a useful yardstick because it links what you pay today to the earnings the business is already generating. It gives you a quick sense of how many dollars investors are currently willing to pay for each dollar of earnings.
What counts as a "normal" P/E often reflects how the market views a company’s growth prospects and risk. Higher expected growth or lower perceived risk can justify a higher multiple, while slower growth or higher risk can point to a lower one.
Best Buy’s current P/E is 21.15x. That sits above the Specialty Retail industry average of 19.55x, but below the peer group average of 32.08x. Simply Wall St’s Fair Ratio for Best Buy is 23.13x, which is its proprietary view of what an appropriate P/E could be given factors such as earnings growth, profit margins, industry, market cap and risk profile.
This Fair Ratio can be more informative than a simple comparison with peers or the industry because it adjusts for the company’s own characteristics rather than relying on broad group averages. With the Fair Ratio above the current P/E, the shares screen as undervalued on this metric.
Result: UNDERVALUED
P/E ratios tell one story, but what if the real opportunity lies elsewhere? Discover 1426 companies where insiders are betting big on explosive growth.
Earlier we mentioned that there is an even better way to understand valuation, so let us introduce you to Narratives. Narratives let you attach your own story about Best Buy to the numbers you use, such as fair value estimates, future revenue, earnings and margins.
A Narrative connects three things: what you think is happening at the company, how that could flow through to a forecast, and what fair value that forecast implies. On Simply Wall St, millions of investors do this on the Community page, using Narratives as a simple tool rather than a complex model.
Once you set up a Best Buy Narrative, you can compare your Fair Value with the current share price to help decide whether it looks attractive, fully valued or expensive. Your view automatically refreshes when new information such as earnings, company updates or news headlines comes in.
For example, one Best Buy Narrative on the Community page might lean on a higher fair value driven by more optimistic assumptions about sales and profitability. Another Narrative could point to a lower fair value based on more cautious expectations for revenue, margins and required return.
Do you think there's more to the story for Best Buy? Head over to our Community to see what others are saying!
This article by Simply Wall St is general in nature. We provide commentary based on historical data and analyst forecasts only using an unbiased methodology and our articles are not intended to be financial advice. It does not constitute a recommendation to buy or sell any stock, and does not take account of your objectives, or your financial situation. We aim to bring you long-term focused analysis driven by fundamental data. Note that our analysis may not factor in the latest price-sensitive company announcements or qualitative material. Simply Wall St has no position in any stocks mentioned.
