
Please use a PC Browser to access Register-Tadawul
Get It
Is Coca-Cola (KO) Still Priced Fairly After Its Recent 1% Monthly Decline?
Coca-Cola Company KO | 77.88 | +0.10% |
A Discounted Cash Flow, or DCF, model estimates what a company could be worth by projecting its future cash flows and then discounting those back to today using a required return.
For Coca-Cola, the model used is a 2 Stage Free Cash Flow to Equity approach. The latest twelve month Free Cash Flow is reported at about US$5.6b. Analyst and extrapolated projections show Free Cash Flow figures in the US$11b to US$19b range over the coming years, with a specific projection of US$15.96b by 2030. Simply Wall St notes that analyst inputs typically cover up to five years and that later years are extrapolated from those assumptions.
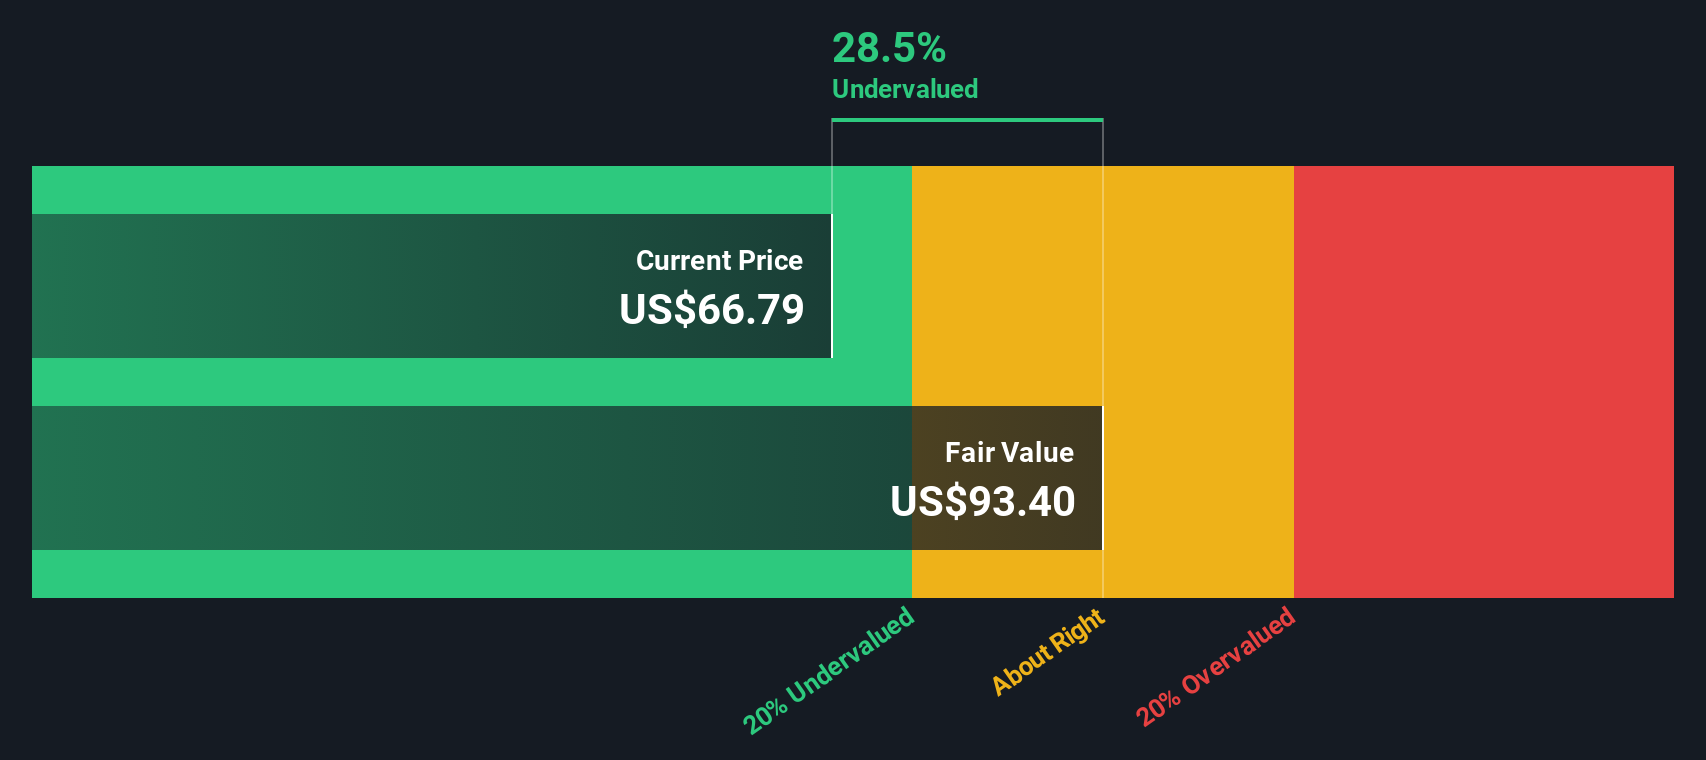
After discounting these projected cash flows, the model arrives at an estimated intrinsic value of US$89.02 per share. Compared with the recent share price of US$69.37, this implies the stock screens as around 22.1% undervalued based on this method alone.
Result: UNDERVALUED
Our Discounted Cash Flow (DCF) analysis suggests Coca-Cola is undervalued by 22.1%. Track this in your watchlist or portfolio, or discover 881 more undervalued stocks based on cash flows.
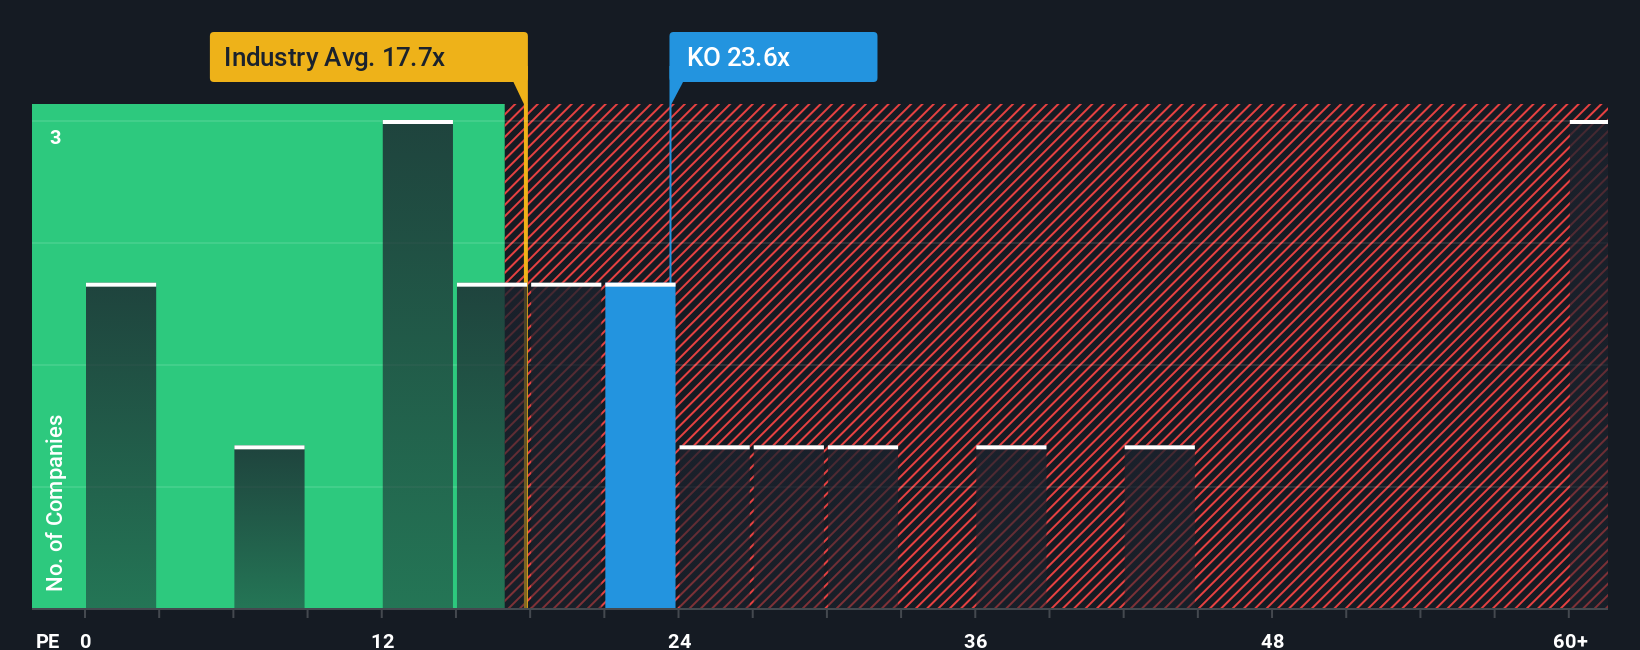
For a profitable company like Coca-Cola, the P/E ratio is a useful way to check how much you are paying for each dollar of earnings. Investors usually accept a higher P/E when they expect stronger growth or see the business as lower risk, while slower growth or higher risk tends to justify a lower, more conservative multiple.
Coca-Cola currently trades on a P/E of 22.90x. That sits above the Beverage industry average of 17.86x, but below the peer group average of 27.27x. Those simple comparisons are a helpful starting point, although they do not tell you whether Coca-Cola’s specific profile of growth, size and risk justifies that level.
Simply Wall St’s Fair Ratio for Coca-Cola is 22.41x. This is a proprietary estimate of what a reasonable P/E might be given the company’s earnings growth characteristics, profit margins, industry, market cap and risk factors. Because it is tailored to the company, it can be more informative than broad industry or peer averages.
With the current P/E of 22.90x sitting slightly above the Fair Ratio of 22.41x, Coca-Cola looks about right on this metric, with only a modest difference between price and the Fair Ratio.
Result: ABOUT RIGHT
P/E ratios tell one story, but what if the real opportunity lies elsewhere? Discover 1445 companies where insiders are betting big on explosive growth.
Earlier we mentioned that there is an even better way to think about valuation, so on Simply Wall St you can use Narratives. These let you write your own story about Coca-Cola, link that story to explicit forecasts for revenue, earnings and margins, convert those forecasts into a Fair Value inside the Community page that millions of investors use, and then compare that Fair Value to today’s price to help decide whether to act. The Narrative automatically updates as new earnings, news or other data arrive. One investor might, for example, see Coca-Cola as a cautious bond substitute with a fair value of US$67.50 per share based on a certain discount rate and growth profile, while another views it as a steady compounder with a fair value closer to US$71.00, each using the same company but a different narrative to guide their decisions.
For Coca-Cola, we will make it really easy for you with previews of two leading Coca-Cola Narratives:
Fair value in this narrative: US$71.00 per share
Implied pricing vs this fair value: around 2.3% undervalued at the recent US$69.37 share price
Revenue growth assumption used: 6.64%
Fair value in this narrative: US$67.50 per share
Implied pricing vs this fair value: around 2.8% overvalued at the recent US$69.37 share price
Revenue growth assumption used: 5.23%
Do you think there's more to the story for Coca-Cola? Head over to our Community to see what others are saying!

This article by Simply Wall St is general in nature. We provide commentary based on historical data and analyst forecasts only using an unbiased methodology and our articles are not intended to be financial advice. It does not constitute a recommendation to buy or sell any stock, and does not take account of your objectives, or your financial situation. We aim to bring you long-term focused analysis driven by fundamental data. Note that our analysis may not factor in the latest price-sensitive company announcements or qualitative material. Simply Wall St has no position in any stocks mentioned.
