
Please use a PC Browser to access Register-Tadawul
Get It
Is H.B. Fuller (FUL) Offering Value After Recent Share Price Stagnation
H.B. Fuller Company FUL | 65.94 | +1.06% |
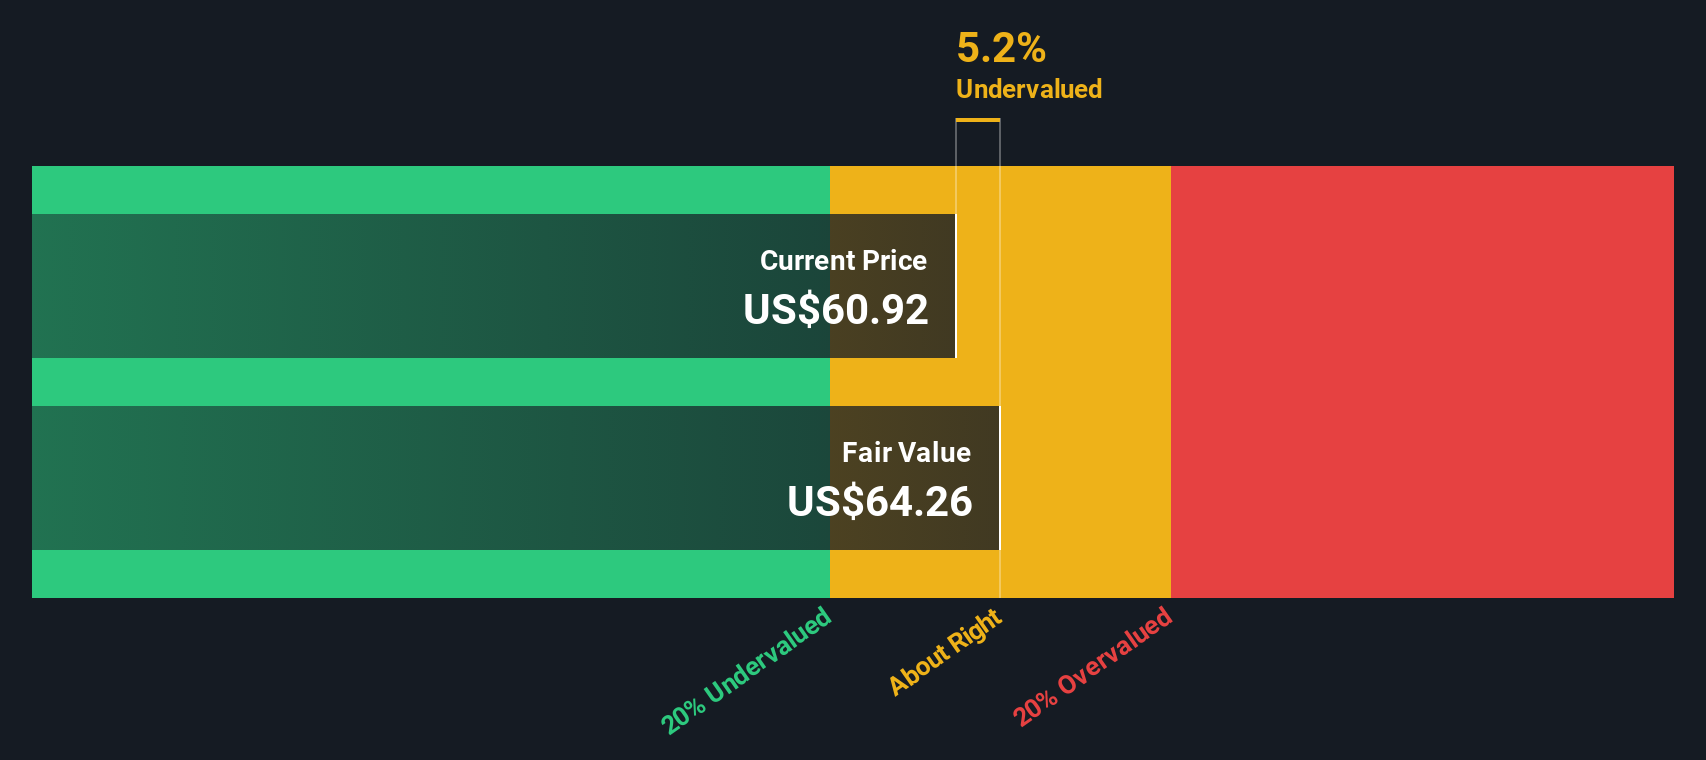
The DCF model estimates what a business could be worth today by projecting its future cash flows and discounting them back to a single present value figure.
For H.B. Fuller, the model uses a 2 Stage Free Cash Flow to Equity approach, starting from last twelve months free cash flow of about $131.5 million. Analysts provide detailed estimates out to 2027, with projected free cash flow of $186.6 million, and further forecasts out to 2035 are extrapolated by Simply Wall St from those inputs.
Over the next ten years, the model discounts each of these projected cash flows, along with a terminal value, to arrive at an estimated intrinsic value of US$78.24 per share. Compared with the recent share price of US$60.10, this implies the stock is trading at about a 23.2% discount to that DCF estimate, which indicates undervaluation on this model.
Result: UNDERVALUED
Our Discounted Cash Flow (DCF) analysis suggests H.B. Fuller is undervalued by 23.2%. Track this in your watchlist or portfolio, or discover 868 more undervalued stocks based on cash flows.
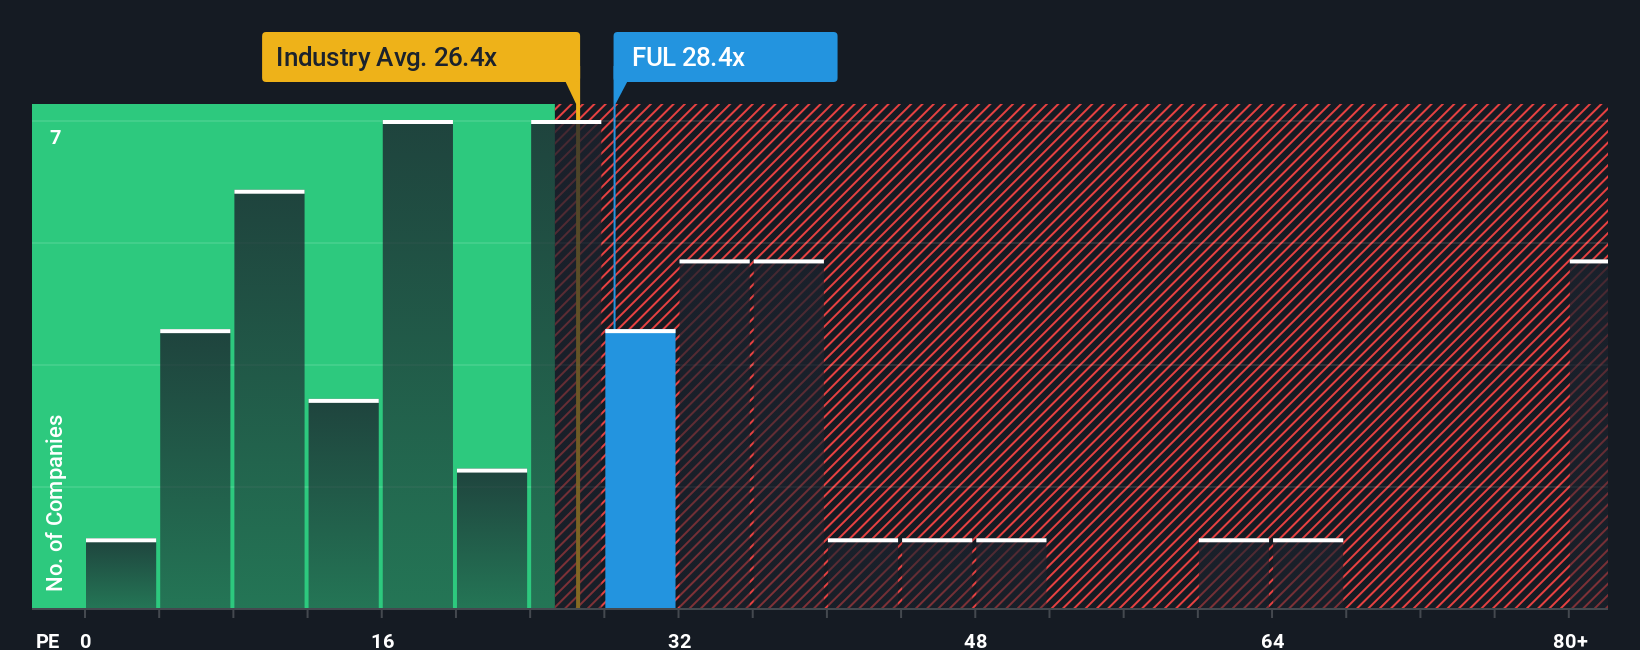
For a profitable company, the P/E ratio is a useful way to see what you are paying today for each dollar of earnings, which makes it a common starting point when you are comparing established businesses.
What counts as a reasonable P/E depends a lot on what investors expect for future growth and how risky the earnings stream appears. Higher expected growth or lower perceived risk can justify a higher P/E, while slower growth or higher uncertainty usually leads to a lower P/E.
H.B. Fuller currently trades on a P/E of 21.48x. That sits below the Chemicals industry average of 23.59x and below a peer group average of 27.28x. Simply Wall St also calculates a proprietary “Fair Ratio” for H.B. Fuller of 19.83x, which reflects factors such as the company’s earnings growth profile, industry, profit margins, market cap and risk profile.
This Fair Ratio can be more tailored than a simple comparison with peers or the industry, because it adjusts for company specific characteristics rather than assuming that all businesses in the group deserve the same multiple. On this measure, H.B. Fuller’s actual P/E of 21.48x sits above the Fair Ratio of 19.83x, which indicates that the shares appear overvalued on this metric.
Result: OVERVALUED
P/E ratios tell one story, but what if the real opportunity lies elsewhere? Discover 1417 companies where insiders are betting big on explosive growth.
Earlier we mentioned that there is an even better way to understand valuation, so let us introduce you to Narratives, which are simply the story you tell about a company, linked directly to what you think its future revenue, earnings and margins could reasonably be and what fair value that suggests.
On Simply Wall St’s Community page, you can build or browse Narratives for H.B. Fuller that connect a clear business story to a set of forecasts. These then roll up into a fair value estimate that you can compare with the current share price to help you decide whether the stock looks attractive, fully priced or expensive for your own goals and risk comfort.
Narratives on the platform are updated when new information such as news or earnings is available. This gives you a way to keep your view of H.B. Fuller current without starting from scratch every time something changes, while still staying grounded in numbers rather than headlines alone.
For example, one investor might set a relatively high fair value based on optimistic assumptions about H.B. Fuller’s future margins and growth. Another might use more cautious estimates and arrive at a much lower fair value, even though both are using the same Narrative framework.
Do you think there's more to the story for H.B. Fuller? Head over to our Community to see what others are saying!

This article by Simply Wall St is general in nature. We provide commentary based on historical data and analyst forecasts only using an unbiased methodology and our articles are not intended to be financial advice. It does not constitute a recommendation to buy or sell any stock, and does not take account of your objectives, or your financial situation. We aim to bring you long-term focused analysis driven by fundamental data. Note that our analysis may not factor in the latest price-sensitive company announcements or qualitative material. Simply Wall St has no position in any stocks mentioned.
