Is H.B. Fuller (FUL) Pricing Look Attractive After Recent Share Price Strength?
H.B. Fuller Company FUL | 62.97 62.97 | -2.48% 0.00% Pre |
- If you are wondering whether H.B. Fuller is fairly priced or offering value at its current US$66.06 share price, you are not alone.
- The stock has returned 9.9% over the last 7 days, 0.9% over the past month, 9.5% year to date and 11.0% over the last year. Its 3 year and 5 year returns sit at a 2.7% decline and 21.6% respectively.
- Recent attention on H.B. Fuller has centered on how the business is positioned within the materials sector and the resilience of its end markets. That context is helping investors reassess both the potential rewards and the risks attached to the current share price.
- Our valuation framework gives H.B. Fuller a 4 out of 6 valuation score. Next, we will look at how different valuation approaches arrive at that result, before finishing with an even more helpful way to think about what the stock might be worth.
Approach 1: H.B. Fuller Discounted Cash Flow (DCF) Analysis
A Discounted Cash Flow, or DCF, model estimates what a company could be worth by projecting its future cash flows and then discounting those back to today in dollar terms.
For H.B. Fuller, the model used is a 2 Stage Free Cash Flow to Equity approach. The latest twelve month free cash flow is about $131.5 million. Analysts provide cash flow estimates out to 2027, with Simply Wall St extending these out to 10 years. On those projections, free cash flow is expected to reach about $333.0 million in 2035, with interim years such as 2026 at $128.6 million and 2027 at $186.6 million.
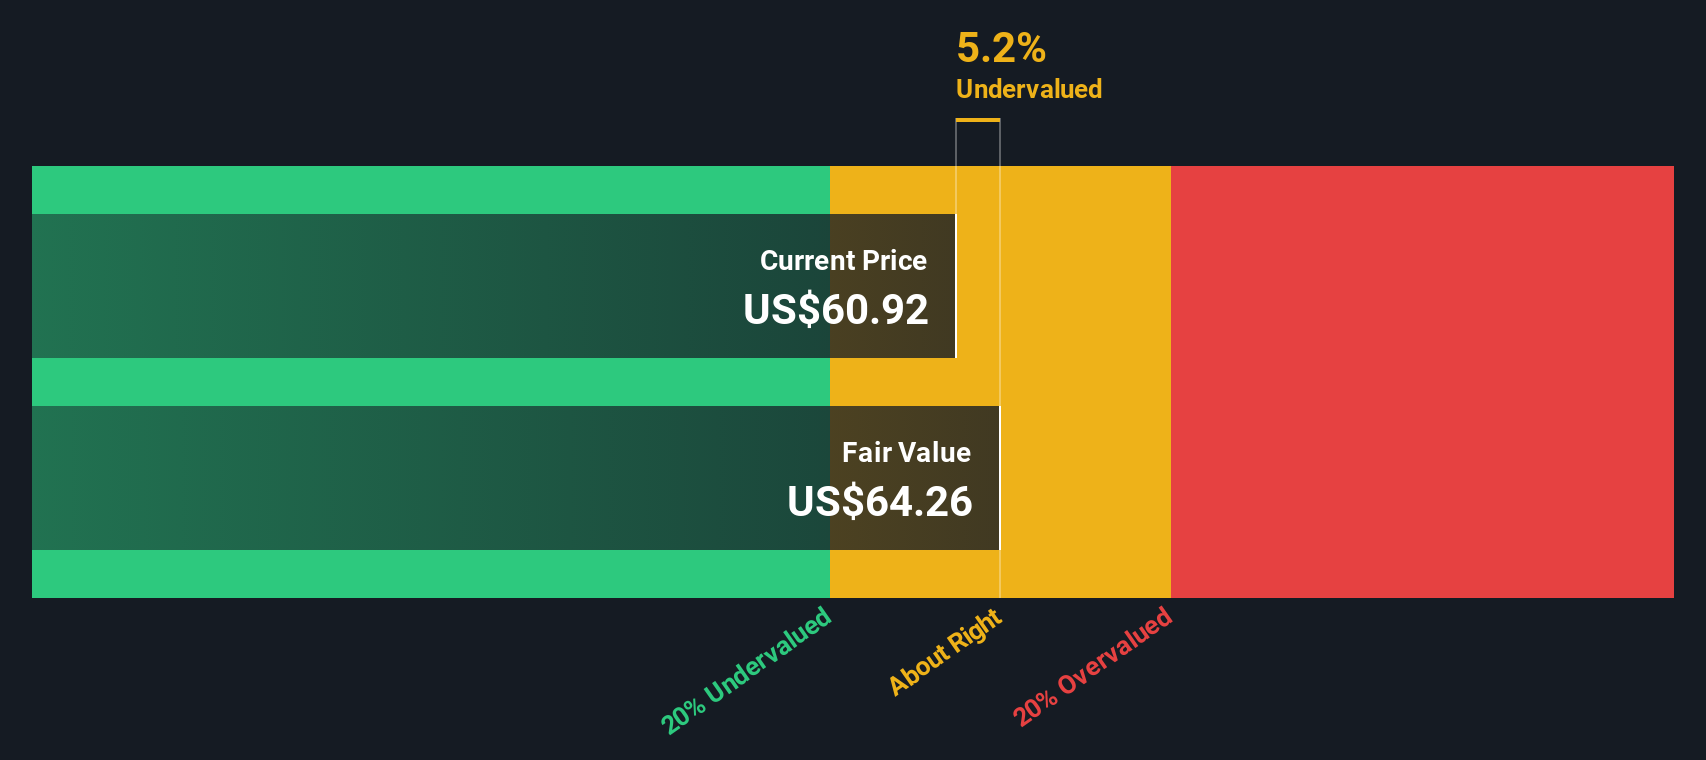
When all those projected cash flows are discounted back and summed, the DCF model produces an estimated intrinsic value of about $82.97 per share. Compared with the recent share price of $66.06, that implies H.B. Fuller is around 20.4% undervalued according to this framework.
Result: UNDERVALUED
Our Discounted Cash Flow (DCF) analysis suggests H.B. Fuller is undervalued by 20.4%. Track this in your watchlist or portfolio, or discover 52 more high quality undervalued stocks.
Approach 2: H.B. Fuller Price vs Earnings
The P/E ratio is a useful way to value a profitable company like H.B. Fuller because it links what you pay per share to the earnings the business is currently generating. It also tends to reflect what the market is willing to pay for each dollar of profit, given its views on growth and risk.
In general, companies with stronger earnings growth and lower perceived risk often trade on higher P/E multiples, while slower growth or higher uncertainty usually lines up with lower P/E levels. That is why a “normal” or “fair” P/E is not the same for every business.
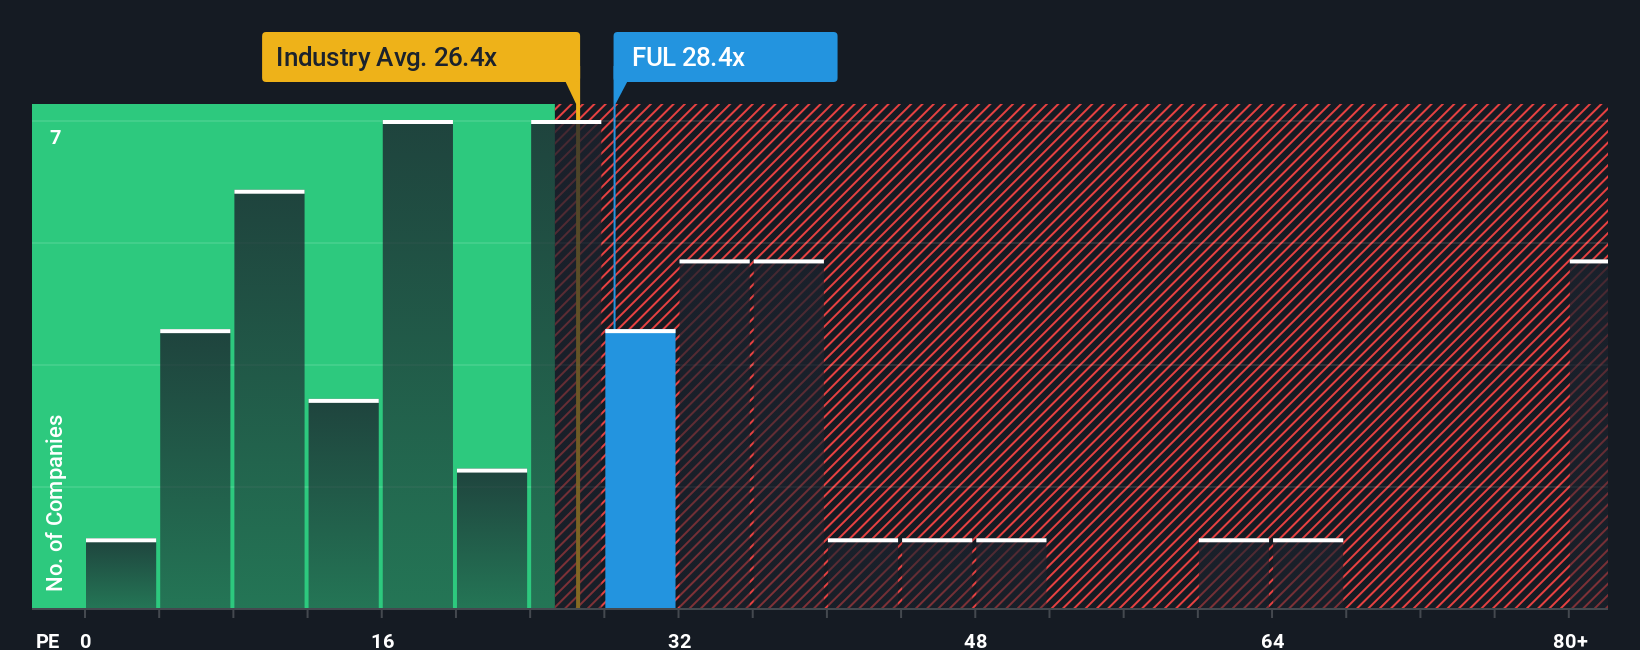
H.B. Fuller currently trades on a P/E of 23.6x, compared with the Chemicals industry average of about 25.4x and a peer group average of 28.5x. Simply Wall St’s Fair Ratio for H.B. Fuller is 20.7x, which is its proprietary view of what the P/E ought to be after factoring in elements like earnings growth, profit margins, industry, market cap and company specific risks. This Fair Ratio can be more informative than simple peer or industry comparisons because it adjusts for the company’s own profile rather than treating all peers as equal. With the current P/E of 23.6x sitting above the Fair Ratio of 20.7x, the multiple based view indicates that the stock may be slightly overvalued.
Result: OVERVALUED
P/E ratios tell one story, but what if the real opportunity lies elsewhere? Start investing in legacies, not executives. Discover our 22 top founder-led companies.
Upgrade Your Decision Making: Choose your H.B. Fuller Narrative
Earlier we mentioned that there is an even better way to think about valuation, so let us introduce you to Narratives, which let you attach your own story about H.B. Fuller to the numbers you care about, such as fair value and your expectations for future revenue, earnings and margins.
A Narrative links what you believe about the business, for example the strength of its end markets or its competitive position in materials, to a financial forecast and then to a fair value per share that you can compare directly with the current price.
On Simply Wall St, Narratives sit inside the Community page as an easy tool that millions of investors use. They update automatically when fresh information comes in, such as new earnings or news, so your fair value view stays aligned with the latest data.
This means you can quickly see whether your Narrative suggests H.B. Fuller is trading above or below your own fair value, which can help you decide if the current price suits your plan. You will often find that some investors use a higher fair value with optimistic margin and revenue expectations, while others use a lower fair value based on more conservative assumptions.
Do you think there's more to the story for H.B. Fuller? Head over to our Community to see what others are saying!

This article by Simply Wall St is general in nature. We provide commentary based on historical data and analyst forecasts only using an unbiased methodology and our articles are not intended to be financial advice. It does not constitute a recommendation to buy or sell any stock, and does not take account of your objectives, or your financial situation. We aim to bring you long-term focused analysis driven by fundamental data. Note that our analysis may not factor in the latest price-sensitive company announcements or qualitative material. Simply Wall St has no position in any stocks mentioned.