
Please use a PC Browser to access Register-Tadawul
Get It
Is It Time To Reassess Carvana (CVNA) After Its Volatile Multi Year Share Price Surge?
Carvana Co. Class A CVNA | 281.28 285.12 | -4.39% +1.37% Post |
A Discounted Cash Flow model estimates what a business could be worth by projecting its future cash flows and then discounting those amounts back to today using a required rate of return.
For Carvana, the model starts with last twelve month free cash flow of about $888.5 million. Analysts provide explicit free cash flow estimates out to 2030, with a projected figure of $4.3b for that year. Beyond those analyst years, Simply Wall St extrapolates additional cash flow projections using its 2 Stage Free Cash Flow to Equity approach, which extends the cash flow path out to 2035 in the model.
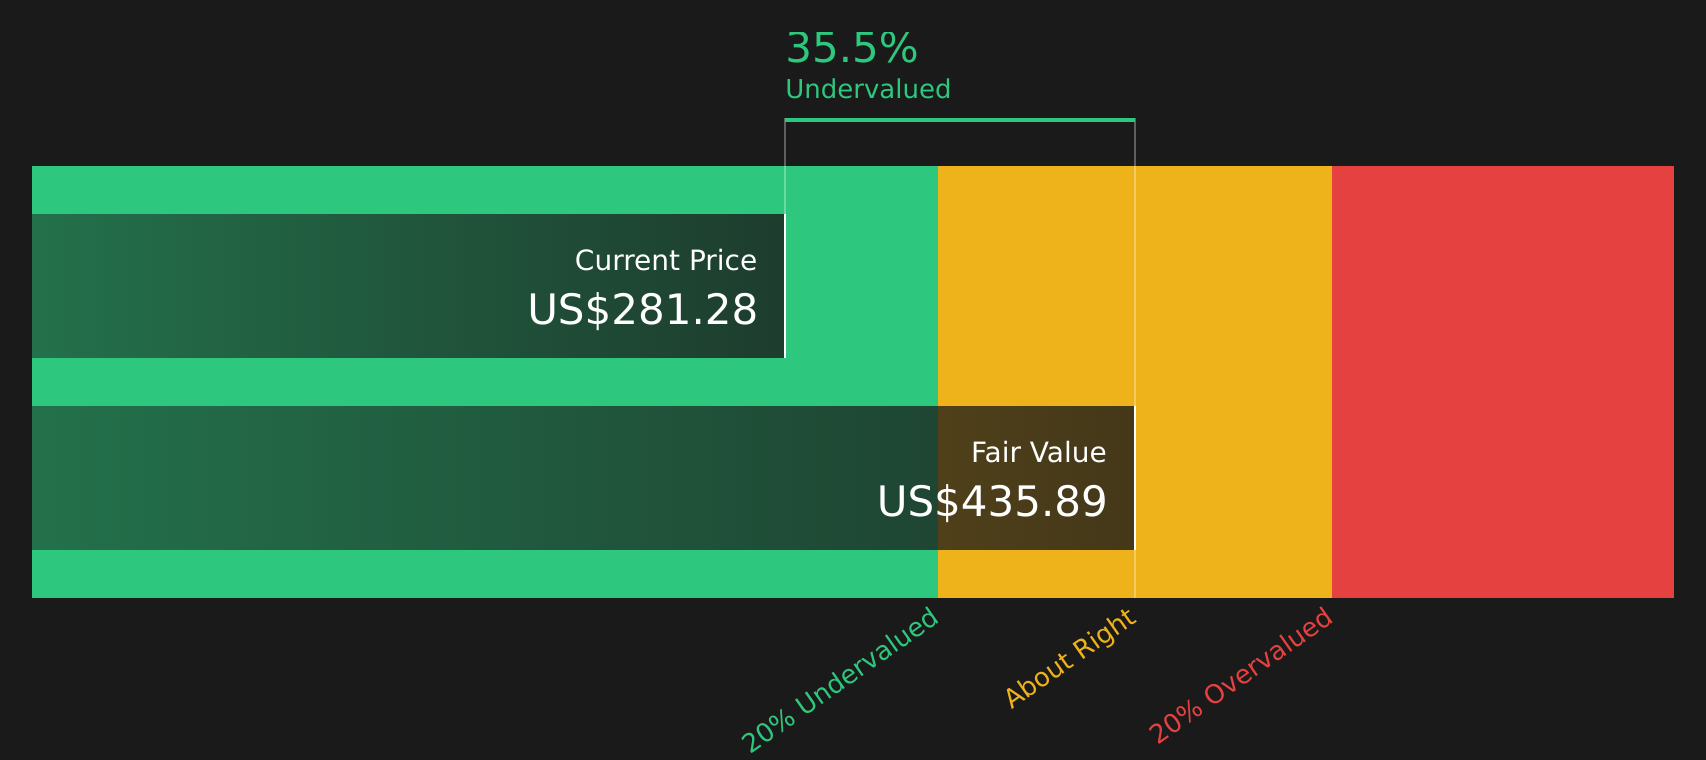
Adding up and discounting all these projected cash flows results in an estimated intrinsic value of $432.59 per share. Compared with the current share price, this outcome implies Carvana is 27.2% undervalued according to this DCF model.
Result: UNDERVALUED
Our Discounted Cash Flow (DCF) analysis suggests Carvana is undervalued by 27.2%. Track this in your watchlist or portfolio, or discover 49 more high quality undervalued stocks.
For profitable companies, the P/E ratio is a common way to think about what you are paying for each dollar of earnings. It helps you see how the market prices a business relative to the profits it currently generates.
What counts as a "normal" or "fair" P/E depends on how fast earnings are expected to grow and how risky those earnings are perceived to be. Higher expected growth or lower perceived risk can justify a higher P/E, while lower growth or higher risk usually points to a lower multiple.
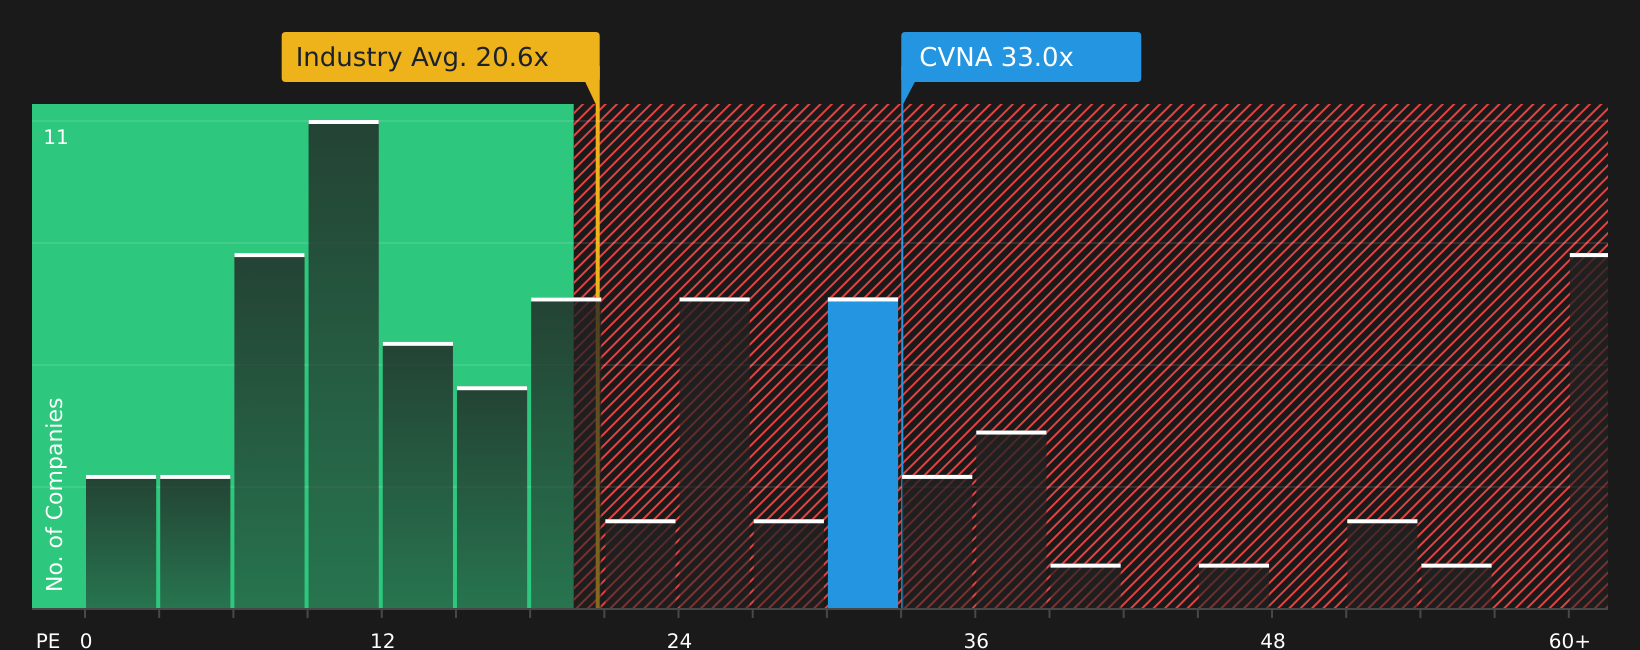
Carvana currently trades on a P/E of 31.99x. That sits above both the Specialty Retail industry average P/E of 18.64x and the peer group average of 17.48x, which indicates that the market is putting a richer price tag on Carvana's earnings than on many of its sector peers.
Simply Wall St's Fair Ratio, at 31.31x, is a proprietary estimate of what Carvana's P/E might be given factors such as its earnings growth profile, industry, profit margins, market cap and risk characteristics. This tailored figure can be more useful than a simple comparison to peers or the broad industry, because it ties the multiple directly to company specific drivers rather than relying only on group averages.
With a Fair Ratio of 31.31x versus the actual P/E of 31.99x, Carvana's valuation on this metric looks slightly higher than the model suggests, although the gap is modest.
Result: OVERVALUED
P/E ratios tell one story, but what if the real opportunity lies elsewhere? Start investing in legacies, not executives. Discover our 20 top founder-led companies.
Earlier it was mentioned that there is an even better way to understand valuation, so Narratives are introduced here as a simple way for you to write the story you believe about Carvana and connect that story directly to assumptions about its future revenue, earnings, margins and a fair value. You can then compare this to the current price on Simply Wall St's Community page, where Narratives are available to millions of users and update automatically when new information arrives. One investor might focus on concerns about accounting practices, debt and subprime exposure and therefore arrive at a very low fair value for NYSE:CVNA. Another might focus on Carvana as a large scale logistics and e commerce platform with higher revenue growth and profitability assumptions and therefore a much higher fair value. Each Narrative turns that viewpoint into a full forecast and a clear fair value vs price comparison that can help you decide whether the stock looks expensive or cheap relative to your own expectations.
For Carvana however we will make it really easy for you with previews of two leading Carvana Narratives:
Fair value in this narrative: US$354.60
Implied undervaluation vs last close: about 11% using the narrative fair value and last close of US$314.74
Revenue growth assumption: 13.15%
Fair value in this narrative: US$0.00
Implied overvaluation vs last close: very large relative to a fair value of zero, using the last close of US$314.74
Revenue growth assumption: 100%
Together these two Narratives show how the same stock can look very different depending on how you weigh growth, balance sheet risk and accounting credibility, so it is worth comparing them against your own expectations before deciding how Carvana fits into your portfolio.
Do you think there's more to the story for Carvana? Head over to our Community to see what others are saying!

This article by Simply Wall St is general in nature. We provide commentary based on historical data and analyst forecasts only using an unbiased methodology and our articles are not intended to be financial advice. It does not constitute a recommendation to buy or sell any stock, and does not take account of your objectives, or your financial situation. We aim to bring you long-term focused analysis driven by fundamental data. Note that our analysis may not factor in the latest price-sensitive company announcements or qualitative material. Simply Wall St has no position in any stocks mentioned.
