
Please use a PC Browser to access Register-Tadawul
Get It
Is It Time To Reconsider Rivian (RIVN) After Recent Share Price Swings?
Rivian Automotive, Inc. Class A RIVN | 15.10 | +0.60% |
Rivian Automotive scores just 2/6 on our valuation checks. See what other red flags we found in the full valuation breakdown.
A Discounted Cash Flow, or DCF, model takes estimates of a company’s future cash flows and discounts them back to today to arrive at an implied value per share. It is essentially asking what those future dollars are worth in today’s terms.
For Rivian Automotive, the model used is a 2 Stage Free Cash Flow to Equity approach. The latest twelve months free cash flow is a loss of about US$2.19b, and the projections provided show free cash flow staying negative through 2028 before turning positive, with US$485.3m in 2029 and US$2.00b in 2030. Beyond the analyst horizon, Simply Wall St extrapolates further cash flows through 2035 based on those earlier inputs.
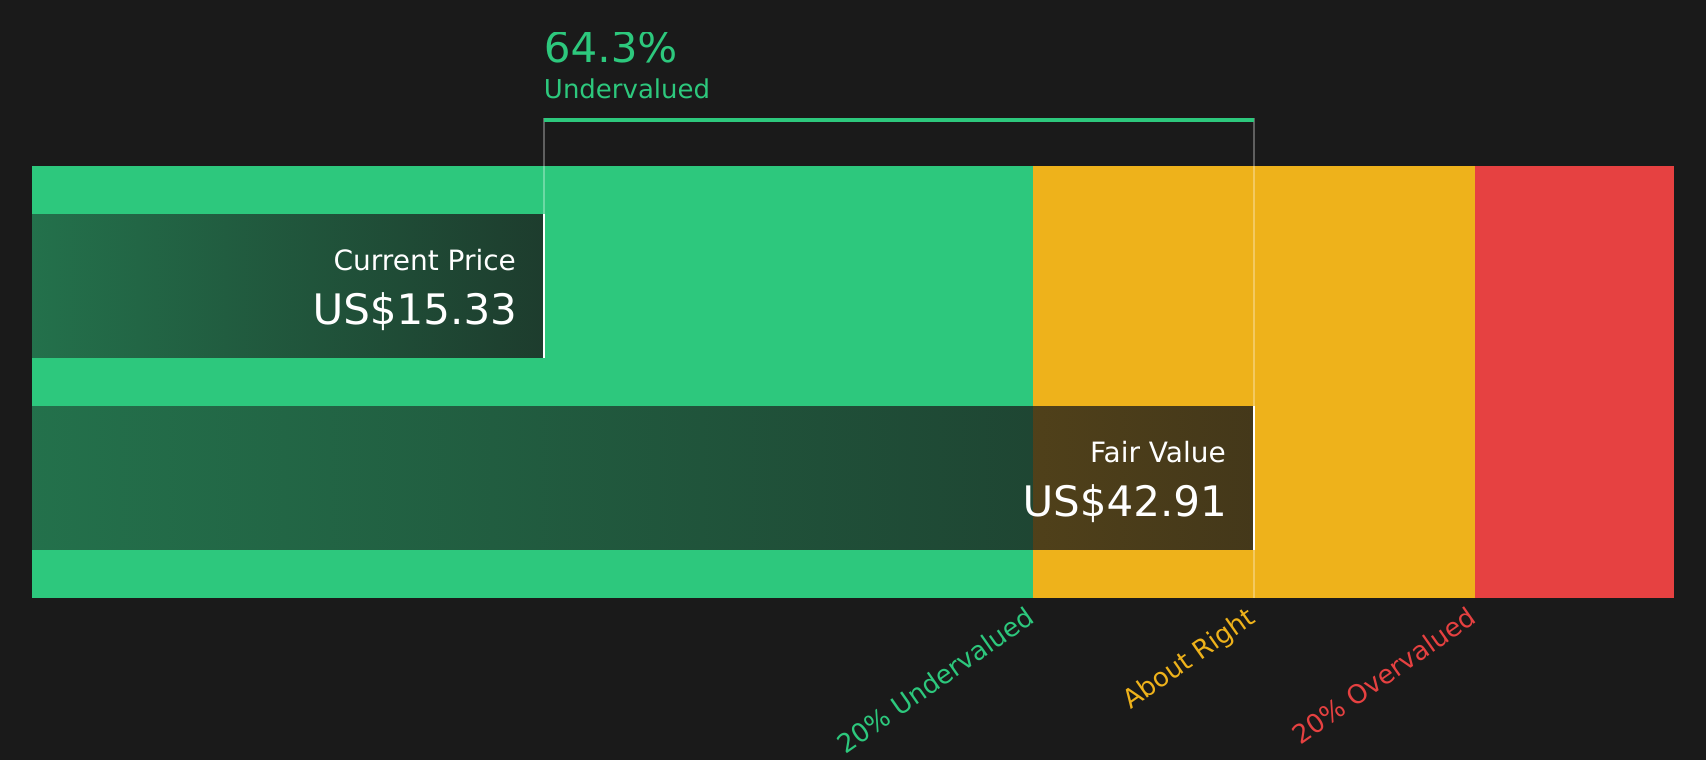
When all those projected cash flows are discounted back, the model arrives at an estimated intrinsic value of about US$42.71 per share. Compared with the recent share price of US$15.12, this model suggests the stock is trading at a 64.6% discount to that DCF estimate, indicating that Rivian appears undervalued on this specific cash flow model.
Result: UNDERVALUED
Our Discounted Cash Flow (DCF) analysis suggests Rivian Automotive is undervalued by 64.6%. Track this in your watchlist or portfolio, or discover 51 more high quality undervalued stocks.
For companies that are not yet consistently profitable, the preferred multiple is often P/S, because it anchors valuation to revenue rather than earnings that can still be heavily affected by investment and scaling costs. Investors usually expect higher P/S ratios when they see stronger growth potential and are comfortable with the risks, while lower P/S ratios tend to reflect more modest growth expectations or higher perceived uncertainty.
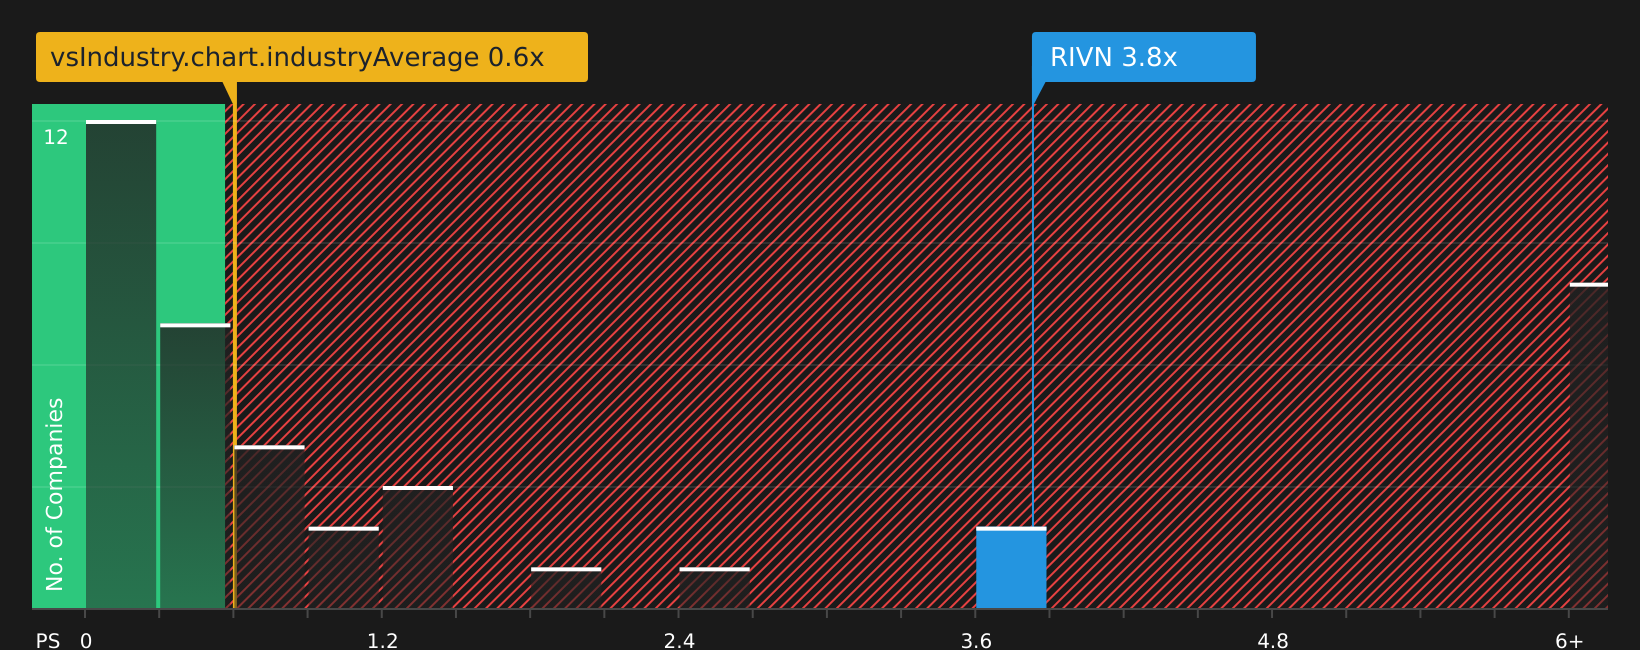
Rivian Automotive currently trades on a P/S ratio of 3.48x. That sits above the Auto industry average of 0.58x and the peer group average of 1.75x. On simple comparisons this can make the stock look relatively expensive. Simply Wall St’s Fair Ratio for Rivian, however, is 1.24x. This is a proprietary estimate of what a reasonable P/S might be, given factors such as the company’s growth profile, profit margins, industry, market cap and key risks.
Because the Fair Ratio brings all of those elements together in one number, it can be more useful than relying only on industry and peer comparisons, which may not fully reflect Rivian’s specific situation. Comparing 3.48x to the 1.24x Fair Ratio suggests the shares are currently pricing in more optimistic assumptions than that model implies.
Result: OVERVALUED
P/S ratios tell one story, but what if the real opportunity lies elsewhere? Start investing in legacies, not executives. Discover our 22 top founder-led companies.
Earlier we mentioned that there is an even better way to understand valuation. Narratives on Simply Wall St let you turn your view of Rivian Automotive into a clear story that connects its products, partnerships and risks to a set of numbers, like your own revenue growth, margin and fair value assumptions. The tool then compares that fair value with the current share price to help you decide whether the stock looks attractive or not for you personally. All of this is available within an accessible tool on the Community page that updates automatically when new news or earnings arrive. For example, a user who thinks Rivian’s R2 platform, autonomy roadmap and joint work with partners can support a fair value around US$25 per share will see a very different Narrative from someone focused on policy headwinds and cash burn who anchors closer to US$10 per share, yet both can track how their stories and fair values evolve as fresh information comes through.
For Rivian Automotive, we will make it really easy for you with previews of two leading Rivian Automotive Narratives:
Fair value: US$16.96 per share
Implied discount to fair value vs last close: 10.8% undervalued
Assumed annual revenue growth: 40.8%
Fair value: US$10.00 per share
Implied premium to fair value vs last close: 51.2% overvalued
Assumed annual revenue growth: 24.8%
If you want to see these stories with all the numbers laid out, including full assumptions and risk checks, you can open each narrative in the Community section for Rivian and compare them side by side, then adjust the inputs to fit your own view of the company.
Do you think there's more to the story for Rivian Automotive? Head over to our Community to see what others are saying!

This article by Simply Wall St is general in nature. We provide commentary based on historical data and analyst forecasts only using an unbiased methodology and our articles are not intended to be financial advice. It does not constitute a recommendation to buy or sell any stock, and does not take account of your objectives, or your financial situation. We aim to bring you long-term focused analysis driven by fundamental data. Note that our analysis may not factor in the latest price-sensitive company announcements or qualitative material. Simply Wall St has no position in any stocks mentioned.
