Is It Too Late To Consider Interactive Brokers Group (IBKR) After Its Strong Multi‑Year Rally?
Interactive Brokers Group, Inc. Class A IBKR | 0.00 |
- If you are wondering whether Interactive Brokers Group is still good value after a strong run, this article will walk through what the current price might be implying about the stock.
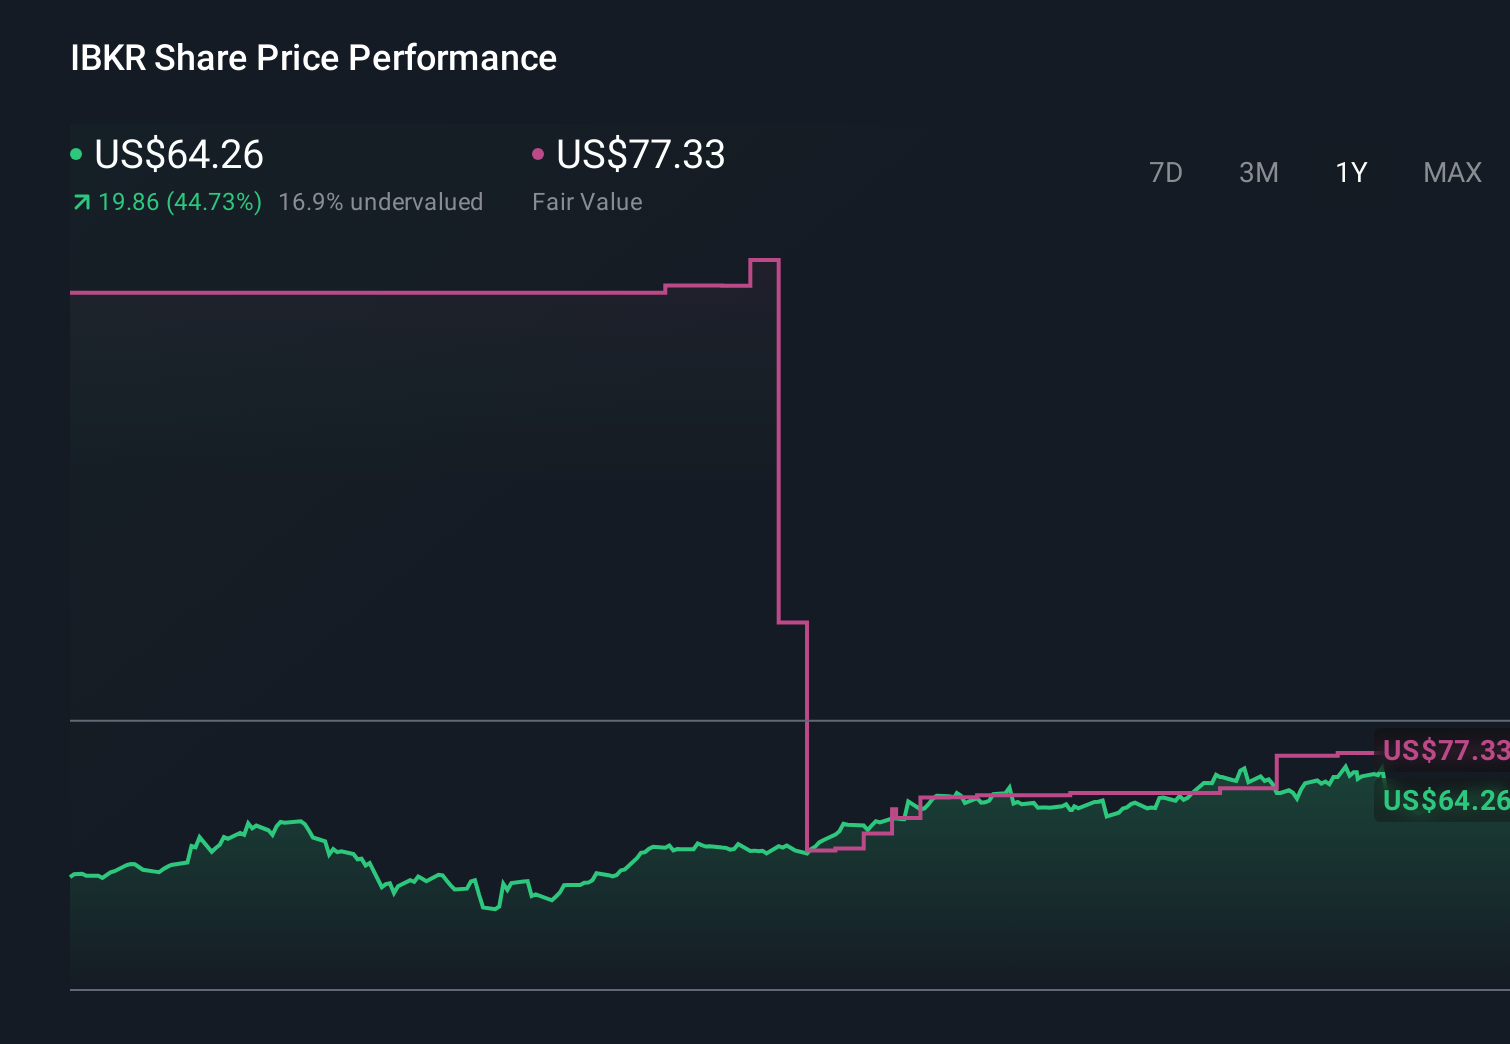
- The share price last closed at US$74.93, with returns of 11.5% over the past month, 11.5% year to date, 36.0% over 1 year, 254.4% over 3 years and 323.4% over 5 years, which naturally raises questions about how much of the story is already priced in.
- Recent news coverage has focused on Interactive Brokers Group's role in the online brokerage space and its position among global trading platforms, which has kept investor attention on the stock. This backdrop helps explain why shorter term moves, such as the recent 11.5% 30 day return following a 0.7% decline over the last week, are getting closer scrutiny.
- According to Simply Wall St's valuation checks, Interactive Brokers Group currently scores 0 out of 6 on potential undervaluation. Next we will look at how methods like discounted cash flow and market multiples line up with that result, and then finish with a different way to think about valuation that can give you more context.
Interactive Brokers Group scores just 0/6 on our valuation checks. See what other red flags we found in the full valuation breakdown.
Approach 1: Interactive Brokers Group Excess Returns Analysis
The Excess Returns model looks at how much profit a company is expected to generate above the return that shareholders require, based on its book value and cost of equity. Instead of focusing on cash flows, it asks whether each dollar of equity is earning more than the shareholder’s required return.
For Interactive Brokers Group, the model uses a Book Value of $12.04 per share and a Stable EPS of $2.52 per share, sourced from weighted future Return on Equity estimates from 4 analysts. The implied Cost of Equity is $1.24 per share, which leaves an Excess Return of $1.28 per share. That excess is built on an Average Return on Equity of 17.04%, applied to a Stable Book Value estimate of $14.78 per share, based on forecasts from 2 analysts.
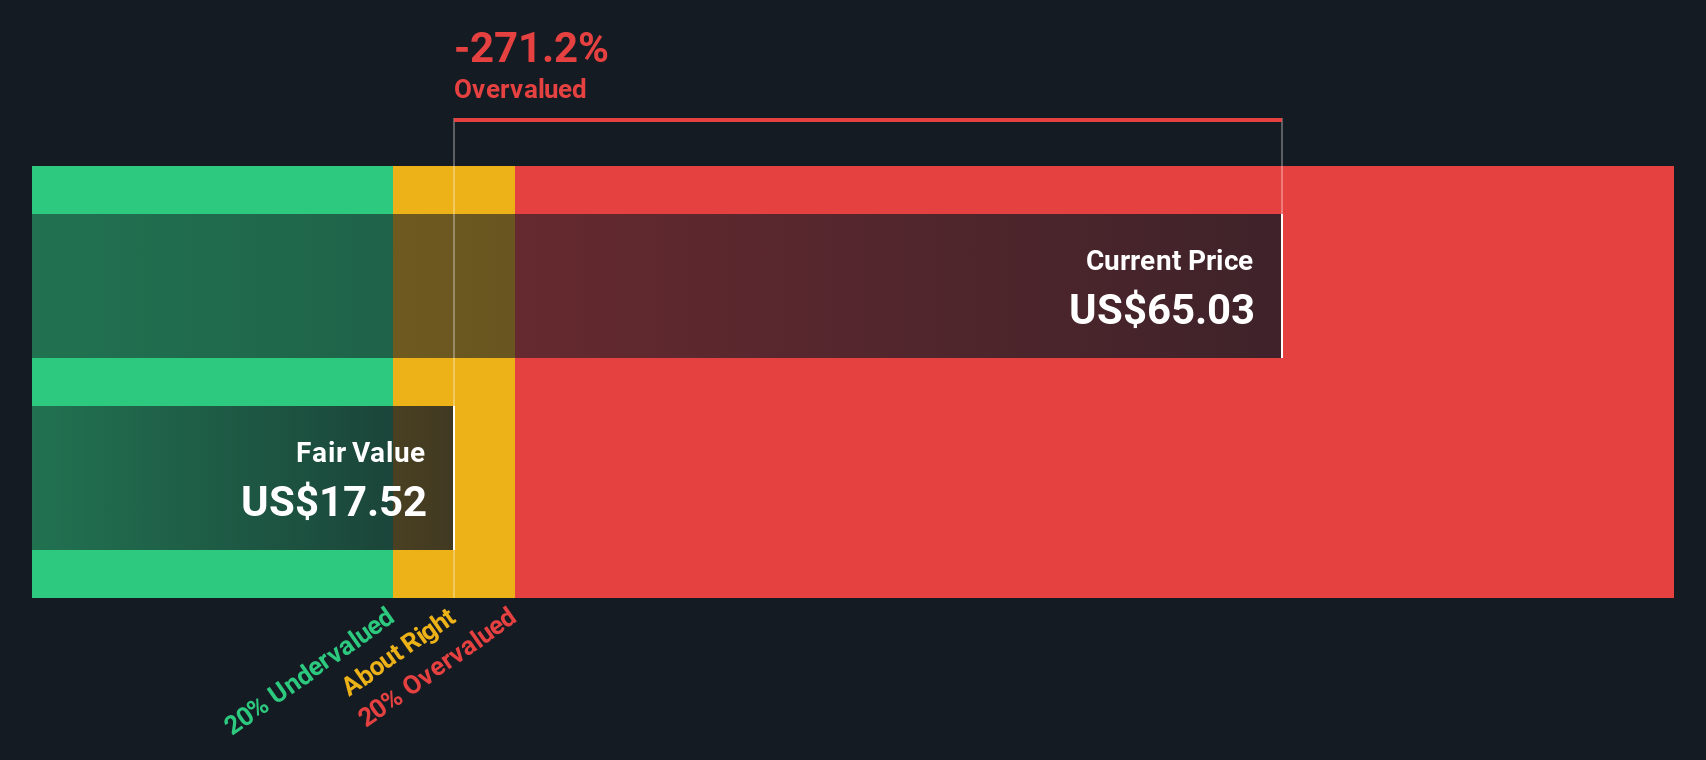
Under this framework, Simply Wall St arrives at an intrinsic value of about $39.64 per share. Compared with the recent share price of US$74.93, the model implies the stock is 89.0% overvalued.
Result: OVERVALUED
Our Excess Returns analysis suggests Interactive Brokers Group may be overvalued by 89.0%. Discover 873 undervalued stocks or create your own screener to find better value opportunities.
Approach 2: Interactive Brokers Group Price vs Earnings
For profitable companies, the P/E ratio is a straightforward way to link what you pay for a share to the earnings it generates. It helps you see how many dollars investors are currently willing to pay for each dollar of earnings, which is often a useful anchor when a business is already earning money rather than burning cash.
What counts as a “normal” P/E will usually reflect how the market views a company’s growth potential and risk. Higher expected growth or lower perceived risk can support a higher P/E, while slower expected growth or higher risk tends to point to a lower, more conservative multiple.
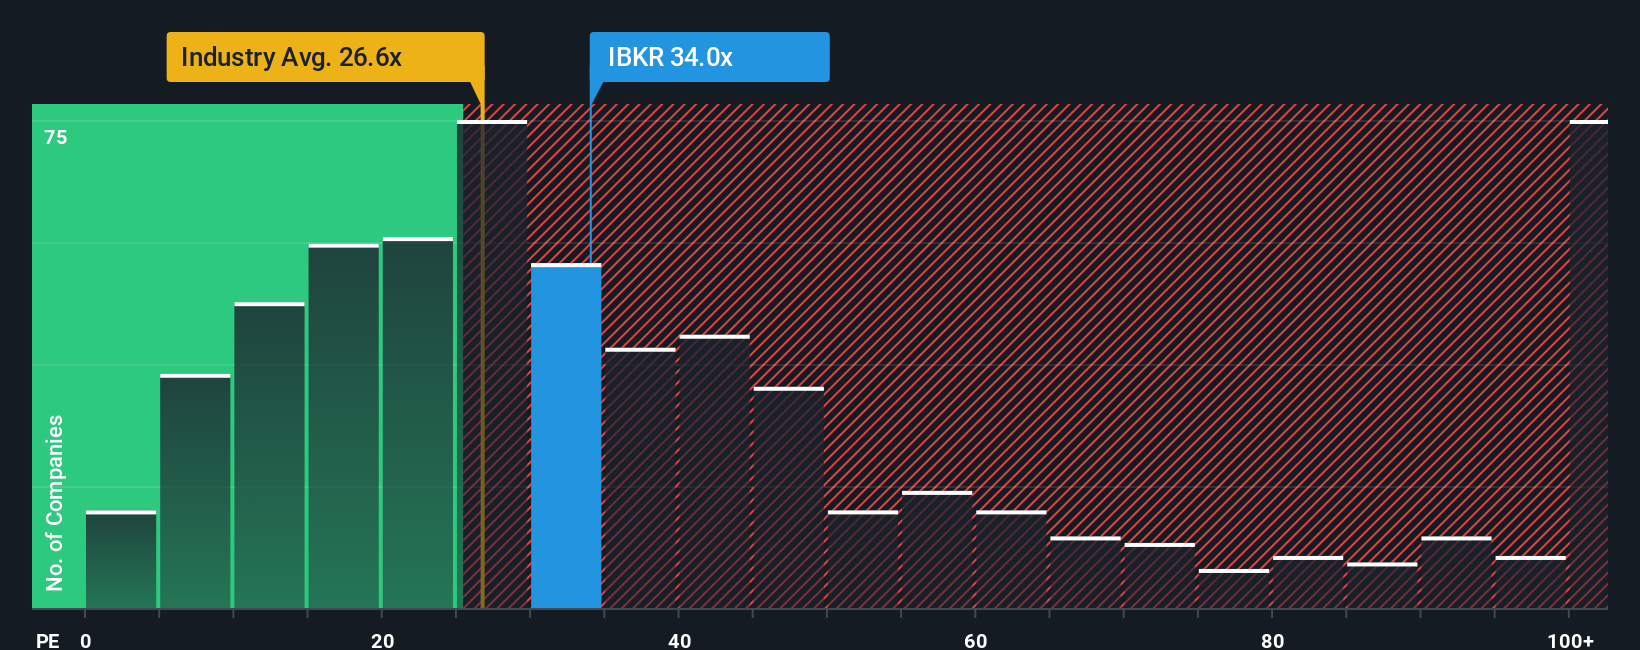
Interactive Brokers Group currently trades on a P/E of 33.91x. That sits above the Capital Markets industry average of 23.75x and the peer average of 23.37x. Simply Wall St’s Fair Ratio for the stock is 21.87x, which is its own estimate of what a reasonable P/E could be given factors such as earnings growth, profit margins, industry, market cap and specific risks. Because the Fair Ratio is tailored to the company’s own profile, it can be more informative than a simple comparison with broad industry or peer averages. On this basis, the current P/E is higher than the Fair Ratio, which suggests the shares are pricing in a richer valuation.
Result: OVERVALUED
P/E ratios tell one story, but what if the real opportunity lies elsewhere? Discover 1426 companies where insiders are betting big on explosive growth.
Upgrade Your Decision Making: Choose your Interactive Brokers Group Narrative
Earlier we mentioned that there is an even better way to understand valuation, so let us introduce you to Narratives, a way to connect your view of a company with the numbers behind it.
A Narrative is simply your story about a business, written in terms of what you think its future revenue, earnings and margins could look like, and what that means for a fair value today.
On Simply Wall St’s Community page, used by millions of investors, Narratives turn that story into a full forecast, then compare your Fair Value to the current price so you can decide whether the gap is large enough for you to consider buying or selling.
Because Narratives update when fresh information arrives, such as new earnings or major news, your fair value view can stay aligned with the latest data instead of a one off spreadsheet.
For Interactive Brokers Group, one investor might build a Narrative that points to a fair value well below US$74.93. Another might see a much higher figure based on a different view of future profitability. These side by side estimates can help you judge where your own expectations sit in the broader range of opinions.
Do you think there's more to the story for Interactive Brokers Group? Head over to our Community to see what others are saying!
This article by Simply Wall St is general in nature. We provide commentary based on historical data and analyst forecasts only using an unbiased methodology and our articles are not intended to be financial advice. It does not constitute a recommendation to buy or sell any stock, and does not take account of your objectives, or your financial situation. We aim to bring you long-term focused analysis driven by fundamental data. Note that our analysis may not factor in the latest price-sensitive company announcements or qualitative material. Simply Wall St has no position in any stocks mentioned.