Is It Too Late To Consider Millrose Properties (MRP) After 59% One-Year Rally?
Millrose Properties Inc Class A MRP | 0.00 |
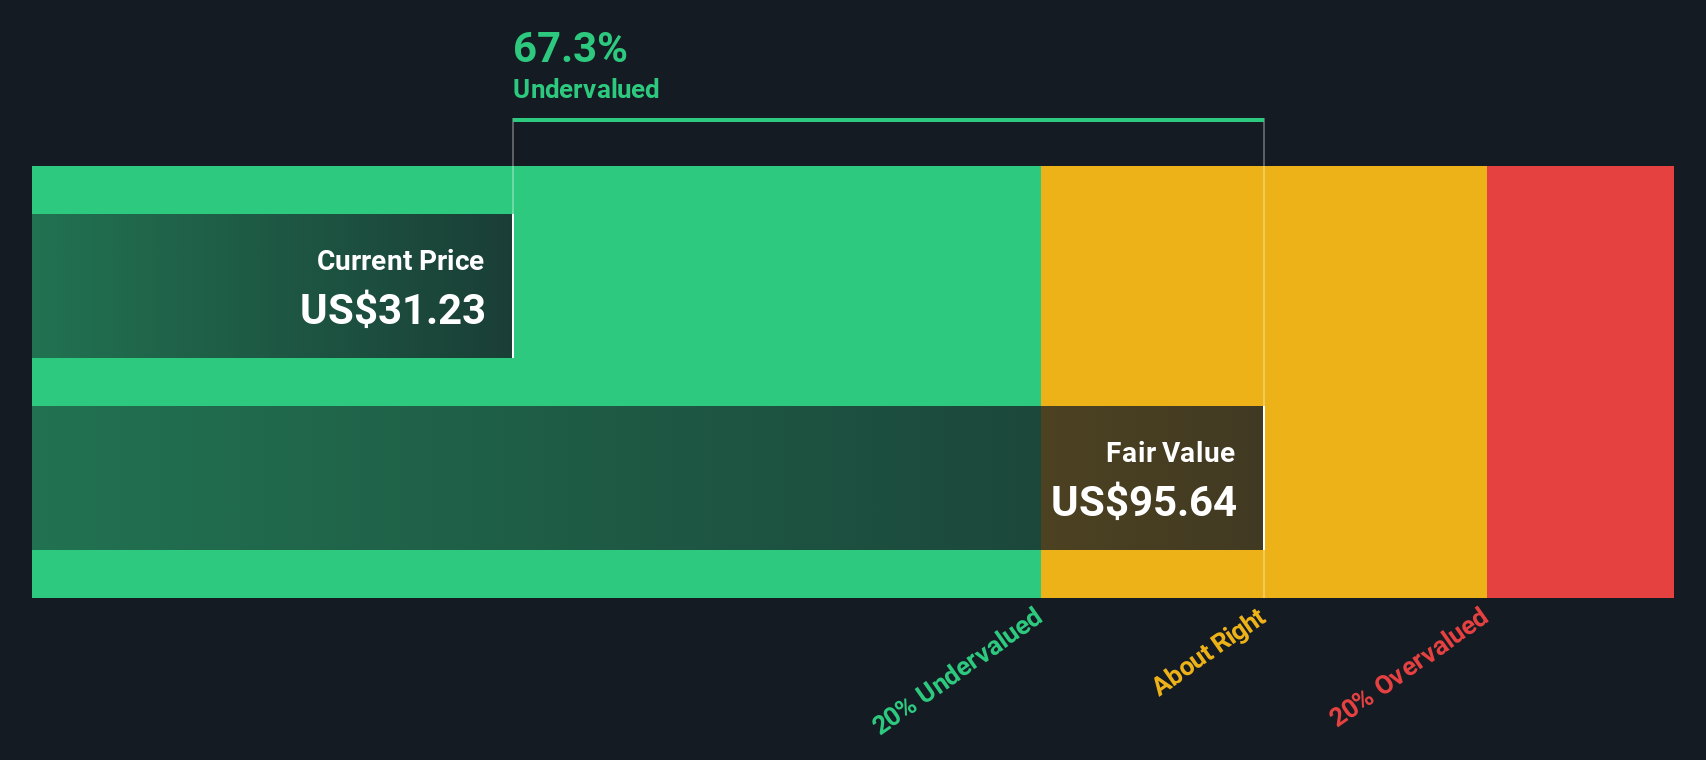
- If you are wondering whether Millrose Properties at US$31.84 is still reasonably priced after its recent run, you are not alone.
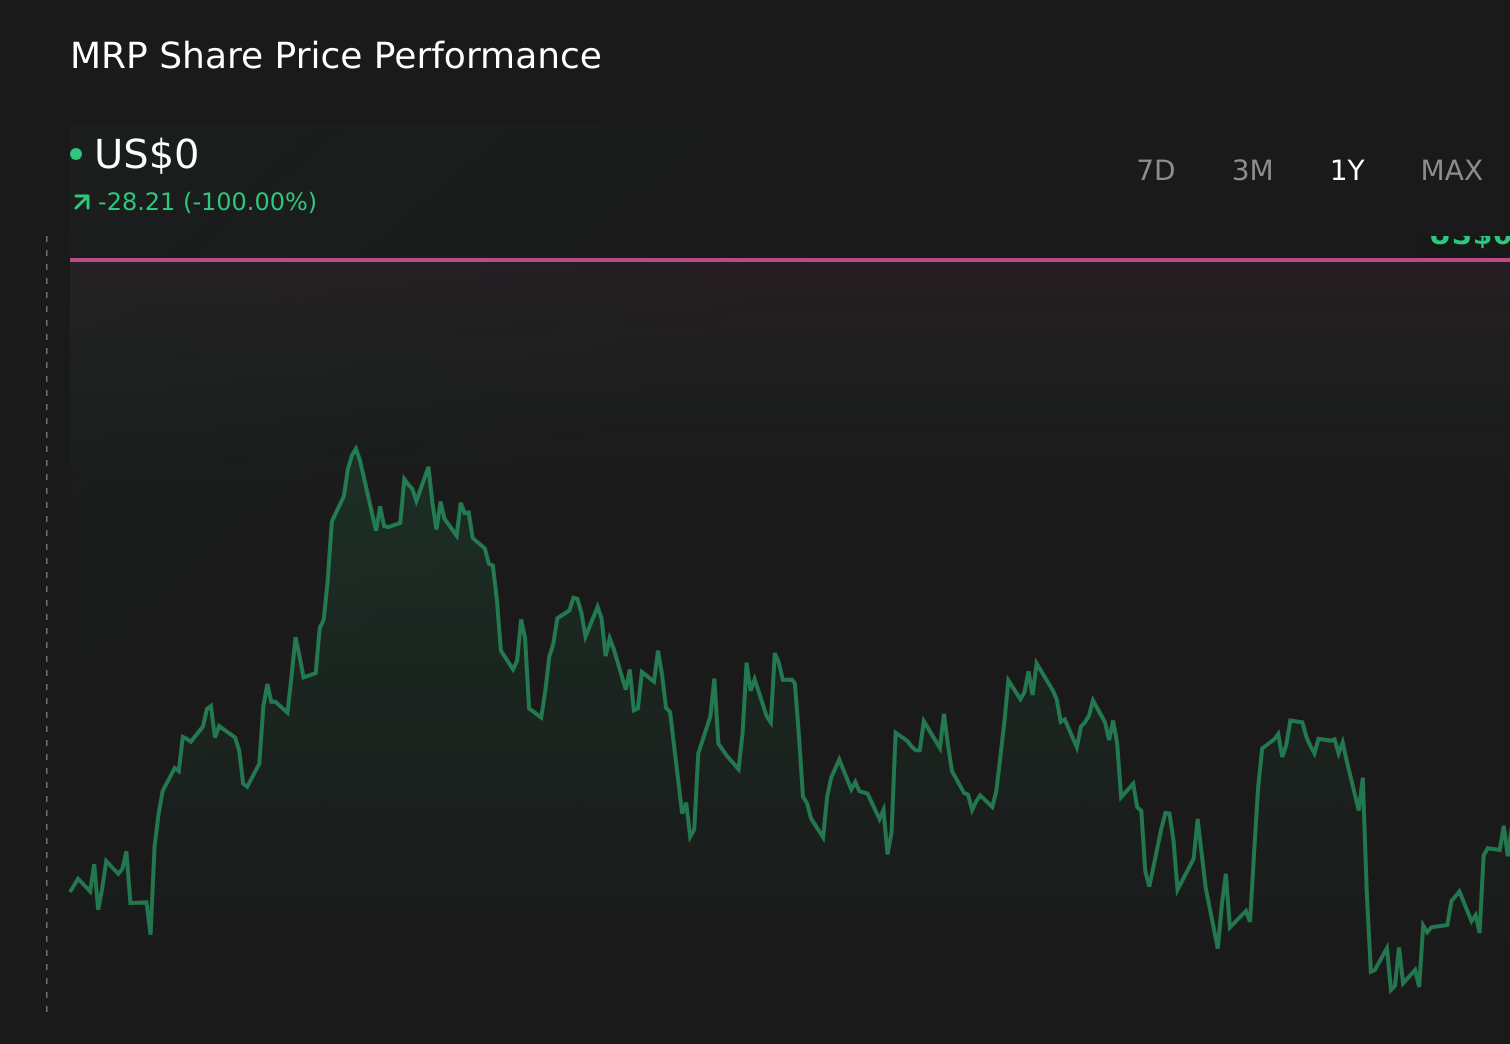
- The stock has returned 4.6% over the last 7 days, 3.7% over the past month, 6.7% year to date, and 59.4% over the past year, which may have shifted how investors see its potential and risk.
- Recently, market attention has centered on Millrose Properties as part of broader interest in US listed real estate names, with investors reassessing how sensitive the sector is to interest rate expectations and funding conditions. At the same time, commentary has focused on how listed property companies are priced compared to the underlying value of their portfolios and the stability of their rental cash flows. This helps frame the latest move in Millrose's share price.
- On our framework, Millrose Properties earns a valuation score of 5 out of 6. This raises the question of how different methods like DCFs, multiples and asset based metrics line up on the stock, and whether there is an even better way to think about value that we will get to at the end of this article.
Approach 1: Millrose Properties Dividend Discount Model (DDM) Analysis
The Dividend Discount Model estimates what a share could be worth by projecting future dividends and discounting them back to today, then comparing that figure to the current price.
For Millrose Properties, the model uses a dividend per share of US$3.11 and a payout ratio of about 106.6% of earnings. That payout level, combined with a reported return on equity of a 2.41% loss, results in a very low implied dividend growth rate of about 0.16%, calculated as described in the DDM inputs.
Despite the pressure that a payout above 100% can put on dividend sustainability, the DDM framework here produces an estimated intrinsic value of about US$39.66 per share. Compared with the current share price of US$31.84, this implies the stock is about 19.7% undervalued on this method, based on dividend projections alone.
Result: UNDERVALUED
Our Dividend Discount Model (DDM) analysis suggests Millrose Properties is undervalued by 19.7%. Track this in your watchlist or portfolio, or discover 51 more high quality undervalued stocks.
Approach 2: Millrose Properties Price vs Earnings
For profitable companies, the P/E ratio is a useful way to see how much investors are paying for each dollar of earnings, which makes it a common shorthand for comparing similar businesses.
What counts as a “normal” P/E often reflects how the market views a company’s growth potential and risk. Higher expected earnings growth or lower perceived risk can support a higher P/E, while lower growth or higher risk usually lines up with a lower multiple.
Millrose Properties currently trades on a P/E of 24.38x. That sits above the Specialized REITs industry average of 16.07x, but slightly below the peer group average of 26.04x. Simply Wall St’s Fair Ratio for Millrose comes in at 47.28x. This is the P/E level suggested by its combination of earnings profile, industry, profit margins, size and risk factors.
The Fair Ratio aims to be more tailored than a simple comparison to peers or the industry. It folds in company specific drivers like growth, risk and profitability alongside sector and market cap characteristics. On this measure, Millrose’s current 24.38x P/E sits well below the 47.28x Fair Ratio, which points to the shares trading on a lower multiple than that framework would suggest.
Result: UNDERVALUED

P/E ratios tell one story, but what if the real opportunity lies elsewhere? Start investing in legacies, not executives. Discover our 22 top founder-led companies.
Upgrade Your Decision Making: Choose your Millrose Properties Narrative
Earlier we mentioned that there is an even better way to understand valuation, so let us introduce you to Narratives. These are Simply Wall St tools on the Community page that let you set out your story for a company like Millrose Properties, link that story to your own revenue, earnings and margin forecasts, turn those forecasts into a Fair Value, then compare that Fair Value to today’s price to help inform your decision. The whole view updates automatically when new news or earnings arrive. For example, one investor might build a Millrose Narrative around analysts expecting revenue to reach about US$1.1b and earnings of US$685.3m by 2028 and see a Fair Value near US$38.60, while another might plug in more cautious assumptions and arrive at a lower Fair Value, with both outcomes clearly tied back to the reasons behind their view.
Do you think there's more to the story for Millrose Properties? Head over to our Community to see what others are saying!
This article by Simply Wall St is general in nature. We provide commentary based on historical data and analyst forecasts only using an unbiased methodology and our articles are not intended to be financial advice. It does not constitute a recommendation to buy or sell any stock, and does not take account of your objectives, or your financial situation. We aim to bring you long-term focused analysis driven by fundamental data. Note that our analysis may not factor in the latest price-sensitive company announcements or qualitative material. Simply Wall St has no position in any stocks mentioned.