
Please use a PC Browser to access Register-Tadawul
Get It
Is Lennar's Valuation Justified Amid Hopes for a US Housing Market Turnaround?
Lennar Corporation Class A LEN | 90.55 91.32 | -3.38% +0.85% Post |
Lennar scores just 1/6 on our valuation checks. See what other red flags we found in the full valuation breakdown.
The Discounted Cash Flow (DCF) model estimates a company's intrinsic value by forecasting its future cash flows and then discounting those back to today's dollars. This approach helps investors gauge what a business is truly worth based on its ability to generate future cash.
For Lennar, the most recent twelve months saw a Free Cash Flow (FCF) of -$702.5 million, reflecting a temporary cash outflow. Looking ahead, analysts project FCF will rebound to $2.15 billion by November 2026. Over the following ten years, estimates suggest FCF will fluctuate, with projections such as $1.74 billion in 2027, $1.34 billion in 2030, and $1.35 billion in 2035, indicating expected moderation in growth over time. (Figures above $1 billion are presented in billions of dollars, all in $.)
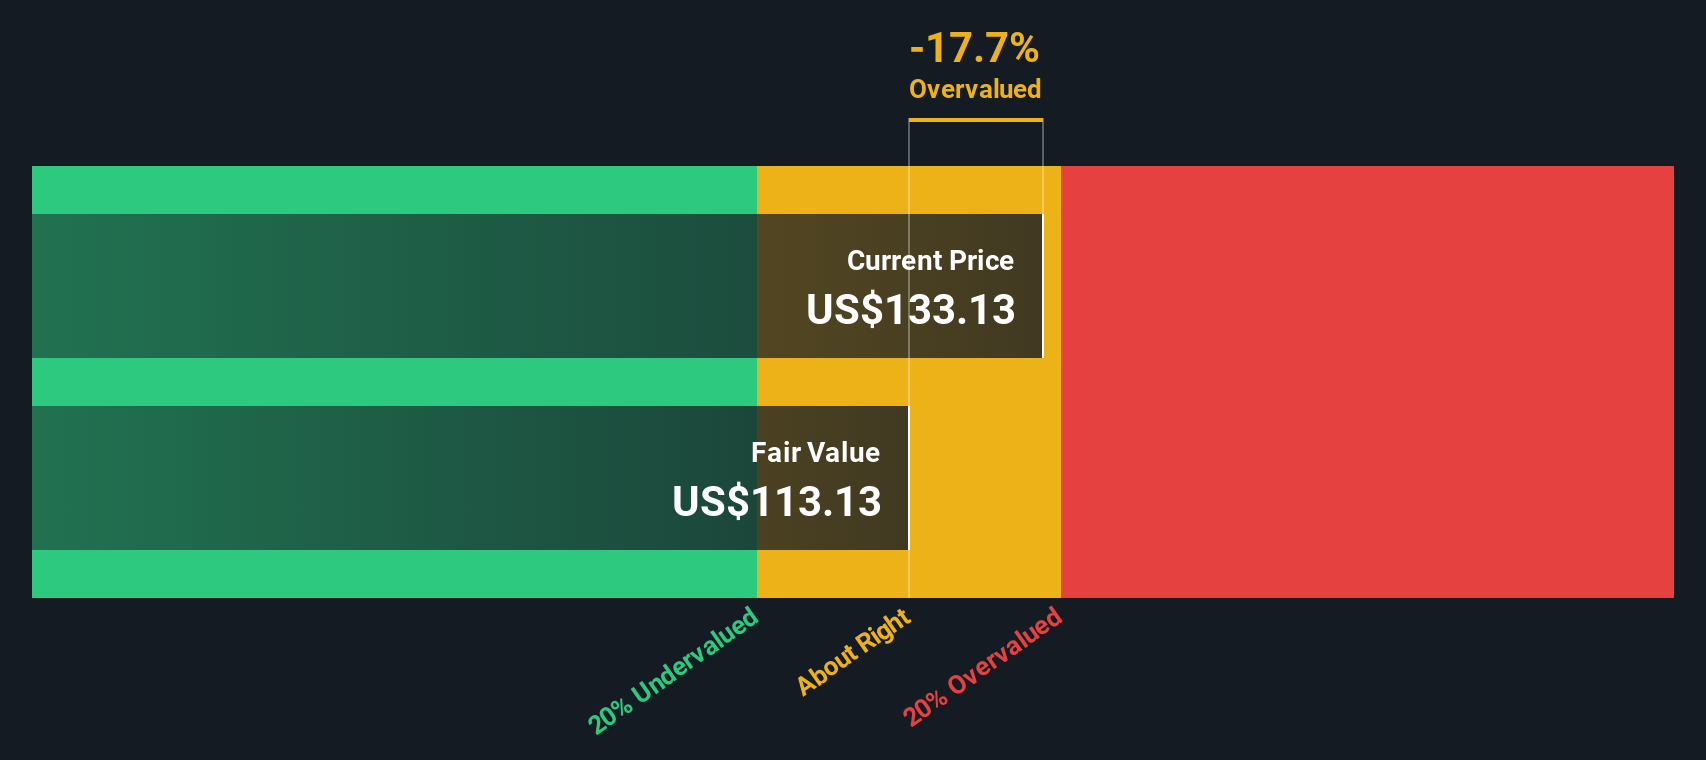
When discounted, these cash flows point to a DCF-based intrinsic value of $81.57 per share. However, this figure is approximately 52.2% below Lennar's current share price, implying the stock may be overvalued according to this long-term cash flow forecast.
Result: OVERVALUED
Our Discounted Cash Flow (DCF) analysis suggests Lennar may be overvalued by 52.2%. Discover 852 undervalued stocks or create your own screener to find better value opportunities.
The Price-to-Earnings (PE) ratio is one of the most widely used metrics for valuing profitable companies because it directly connects a stock’s price to its bottom-line performance. Investors favor the PE ratio when assessing companies like Lennar that have consistent earnings, as it offers a straightforward way to judge whether the market is paying too much or too little for each dollar of profit.
It’s important to remember that what counts as a “normal” or “fair” PE ratio is shaped by two big factors: expected earnings growth and the riskiness of those earnings. Companies with higher growth prospects often trade at higher PE ratios. Those with more uncertain or cyclical earnings tend to have lower ones.
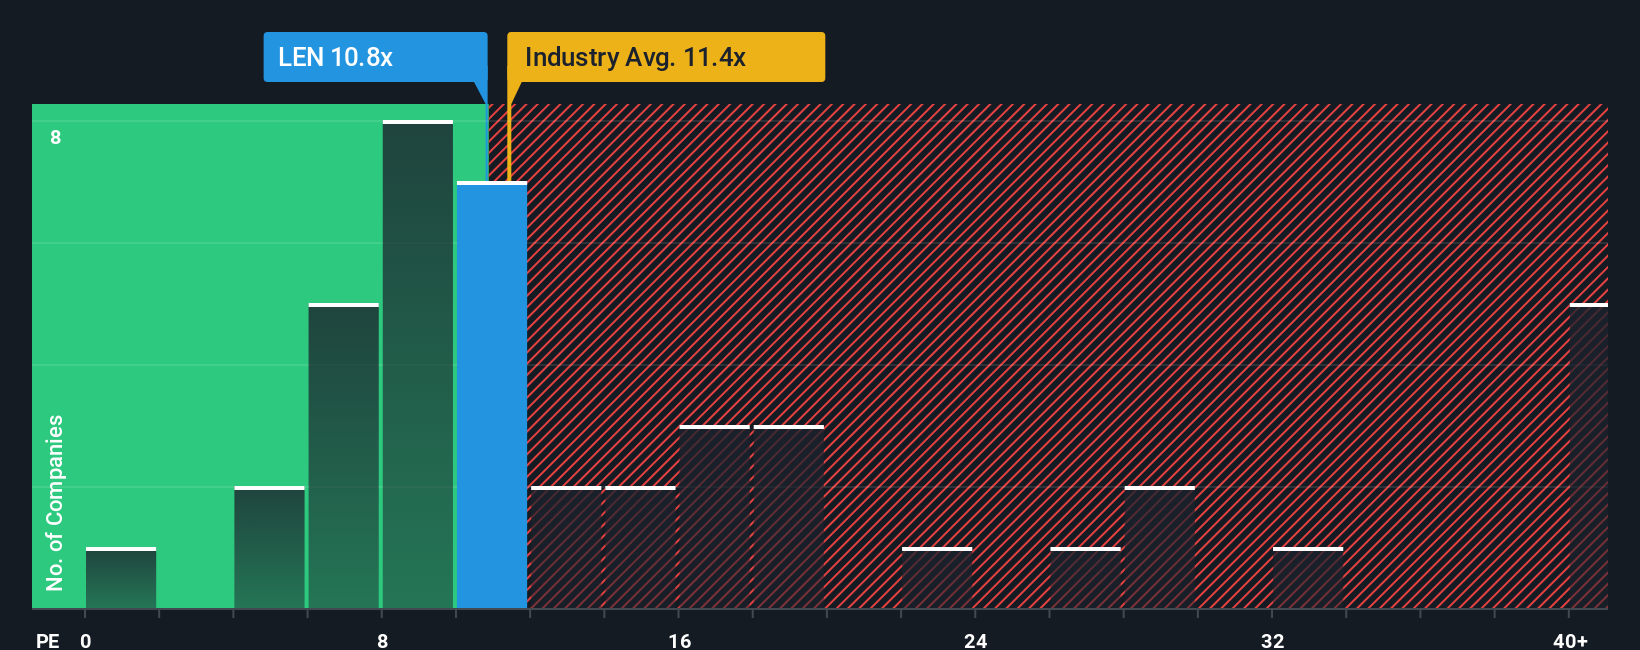
Lennar currently trades at an 11.9x PE ratio. For comparison, the industry average PE sits at 10.6x, and the typical peer average is 11.3x. While Lennar’s multiple is slightly higher than both benchmarks, it reflects modestly above-average expectations from investors.
This is where Simply Wall St’s “Fair Ratio” can offer sharper insight. The Fair Ratio for Lennar is calculated at 16.8x, pulling in factors such as the company’s earnings growth outlook, profit margins, size, industry dynamics, and risk profile. Unlike a simple industry or peer comparison, the Fair Ratio is tailored to Lennar’s specific situation. This gives you a more customized sense of fair value.
With Lennar’s actual PE ratio of 11.9x well below the Fair Ratio of 16.8x, the company looks undervalued on this basis. This suggests the stock could have room to run if its fundamentals continue to hold up or improve.
Result: UNDERVALUED
PE ratios tell one story, but what if the real opportunity lies elsewhere? Discover 1403 companies where insiders are betting big on explosive growth.
Earlier, we mentioned that there is an even better way to understand valuation, so let’s introduce you to Narratives. A Narrative is a simple, story-driven approach to investing that links your perspective on a company, such as what you believe will happen with Lennar’s earnings, margins, and future, directly to a set of financial forecasts and a calculated fair value.
Rather than sticking to static ratios or complex models, Narratives make valuation dynamic by letting investors describe the “why” behind their assumptions and translating a company’s story into quantifiable numbers. This feature is easy to use and available to everyone within the Simply Wall St Community page, helping millions of investors visualize their outlook and compare it to others.
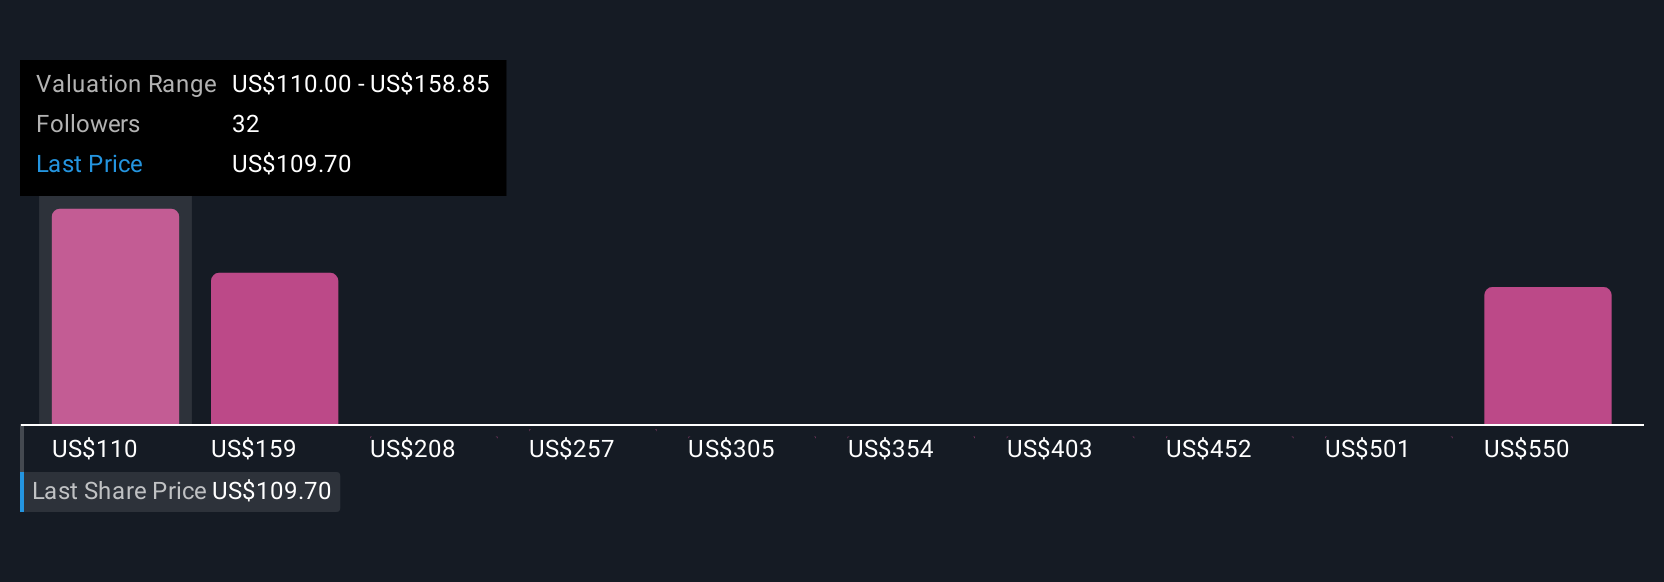
With Narratives, you can see clearly when to buy or sell by comparing your calculated Fair Value against the current share price. As new news, policies, or results are announced, your Narrative will automatically update to reflect the latest data. For example, some Lennar Narratives are built on a bullish view with a fair value of $162.49 (expecting profit growth and margin recovery), while others are more cautious with fair value around $127.50 (projecting margin pressure and softer demand), demonstrating just how personalized and insightful your investment approach can become.
Do you think there's more to the story for Lennar? Head over to our Community to see what others are saying!
This article by Simply Wall St is general in nature. We provide commentary based on historical data and analyst forecasts only using an unbiased methodology and our articles are not intended to be financial advice. It does not constitute a recommendation to buy or sell any stock, and does not take account of your objectives, or your financial situation. We aim to bring you long-term focused analysis driven by fundamental data. Note that our analysis may not factor in the latest price-sensitive company announcements or qualitative material. Simply Wall St has no position in any stocks mentioned.
