
Please use a PC Browser to access Register-Tadawul
Get It
Is PAR Technology (PAR) Attractive After Multi Year Share Price Weakness?
PAR Technology Corporation PAR | 33.90 33.88 | +1.53% -0.06% Post |
A Discounted Cash Flow model estimates what a company might be worth by projecting its future cash flows and then discounting those back to today using a required rate of return. It is essentially asking what those future dollars are worth in present terms.
For PAR Technology, the latest twelve month Free Cash Flow is a loss of $22.84 million. Analysts have provided cash flow estimates out to 2027, with Simply Wall St extrapolating further to build a 2 Stage Free Cash Flow to Equity model. Under this framework, projected Free Cash Flow for 2035 is $255.76 million, with intermediate years between 2026 and 2034 stepping up from $29.54 million to $239.47 million, all in dollar terms.
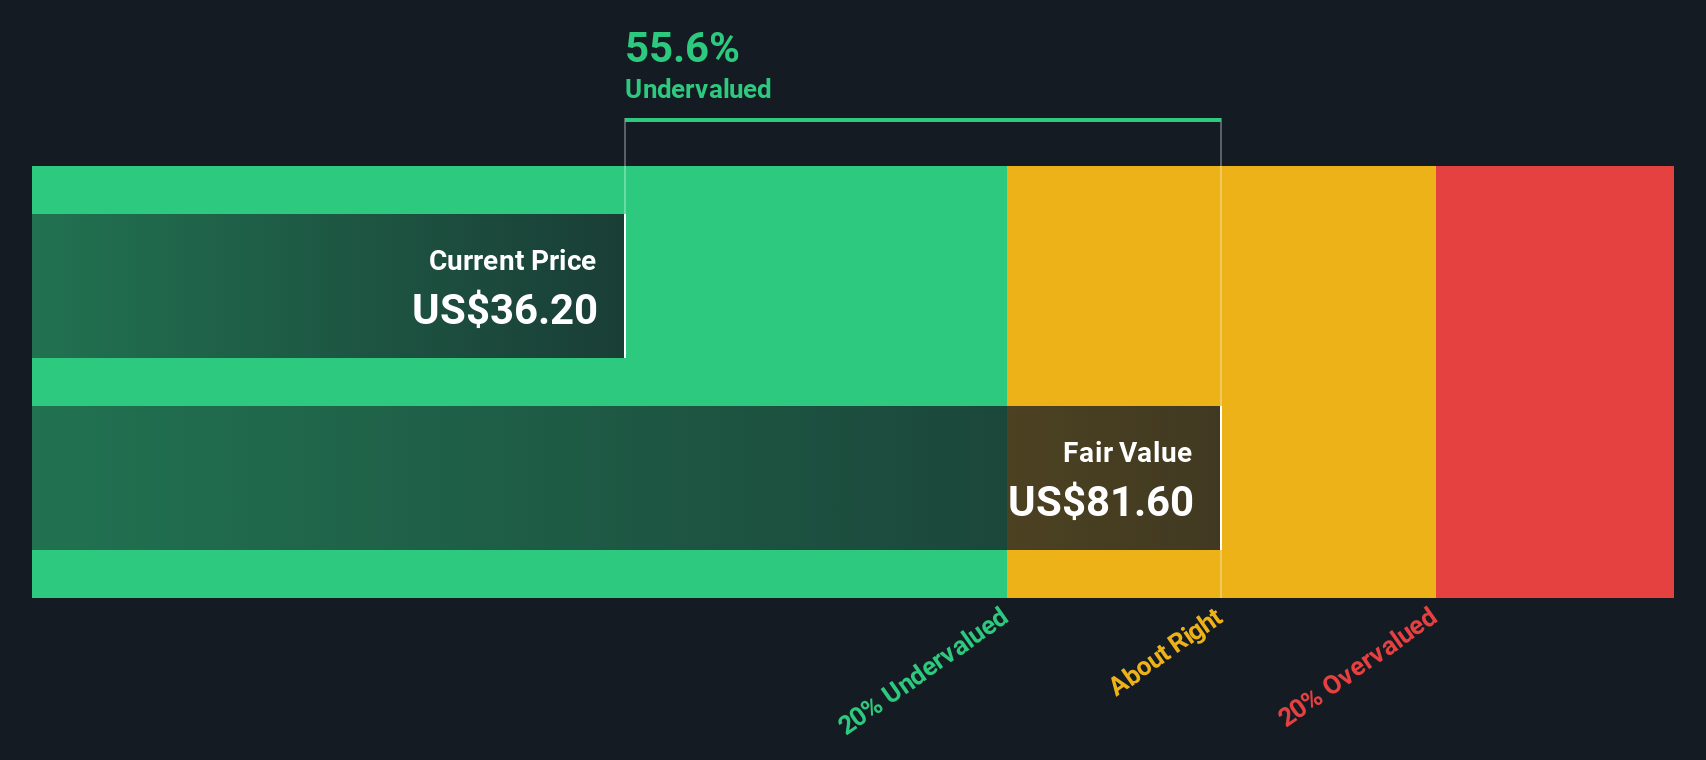
When those projected cash flows are discounted back, the model arrives at an intrinsic value of about $66.12 per share. Against a recent share price of roughly $37.19, this implies an intrinsic discount of 43.8%, which indicates that the stock is trading below this DCF estimate.
Result: UNDERVALUED
Our Discounted Cash Flow (DCF) analysis suggests PAR Technology is undervalued by 43.8%. Track this in your watchlist or portfolio, or discover 881 more undervalued stocks based on cash flows.
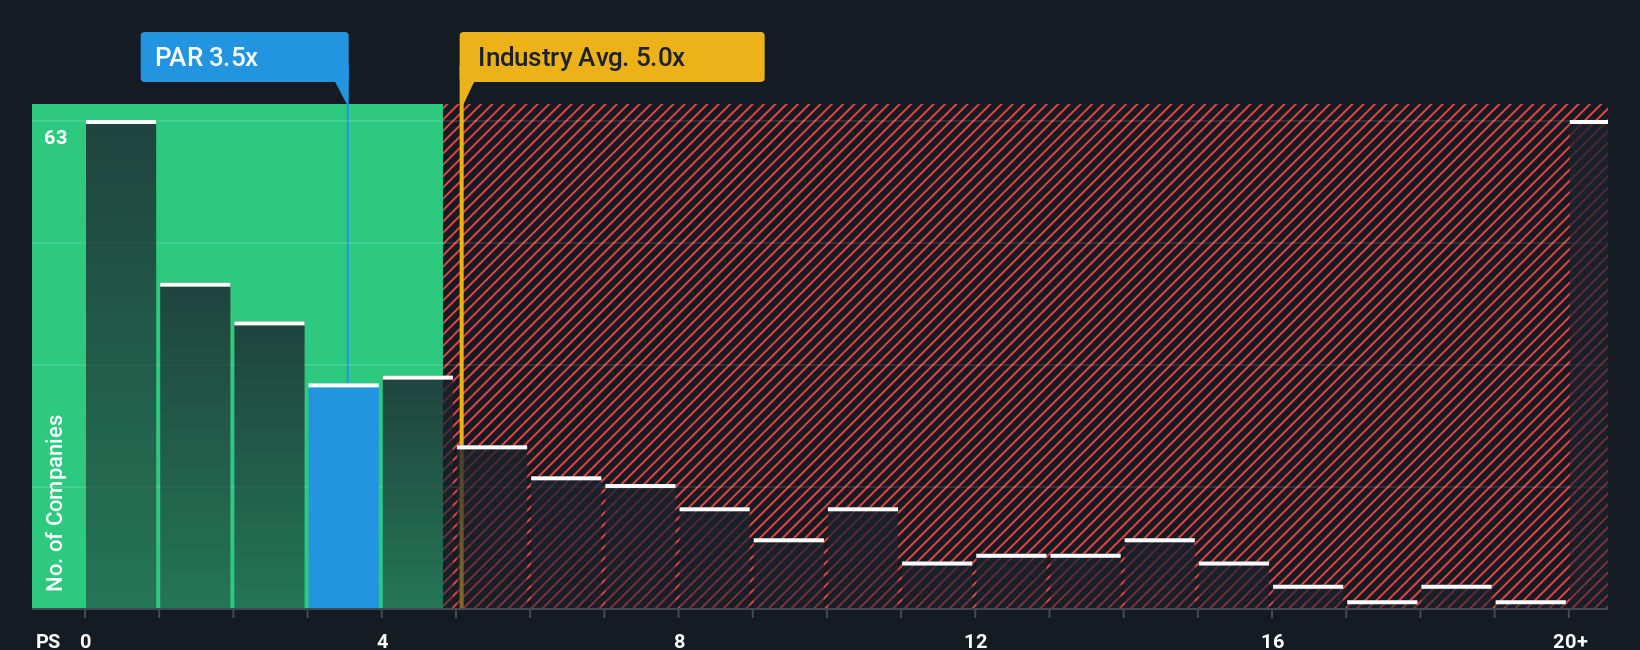
For companies where earnings are not yet a steady guide, the P/S ratio is often a useful yardstick because it compares the value the market places on the business to the revenue it is already generating.
In general, higher expected growth and lower perceived risk tend to support a higher “normal” multiple, while slower growth and higher risk point to a lower one. For PAR Technology, the current P/S ratio is 3.43x. That sits below the Software industry average of 4.91x and also below the peer group average of 6.24x, which may catch your eye if you are comparing it with similar names.
Simply Wall St’s Fair Ratio for PAR Technology is 2.19x. This is a proprietary estimate of what a reasonable P/S might be, taking into account factors such as the company’s earnings profile, growth characteristics, profit margins, size and risk, rather than just lining it up against broad industry or peer averages. On this measure, the current 3.43x P/S is above the 2.19x Fair Ratio, suggesting the shares are pricing in more optimism than this framework would imply.
Result: OVERVALUED
P/S ratios tell one story, but what if the real opportunity lies elsewhere? Discover 1445 companies where insiders are betting big on explosive growth.
Earlier we mentioned that there is an even better way to understand valuation. On Simply Wall St’s Community page you can use Narratives, where you attach your story about PAR Technology to the numbers by linking your view of its future revenue, earnings and margins to a forecast and fair value. You can then see in real time how that fair value compares with today’s price to help you decide whether to buy, hold or sell, and watch it update automatically when new earnings or product news arrives. One investor, for example, has built a bullish PAR Technology Narrative around a fair value near US$97.00 based on strong adoption of new restaurant tech offerings, while another anchors a more cautious Narrative closer to US$50.00, both using the same tools but different assumptions to reach their own conclusions.
Do you think there's more to the story for PAR Technology? Head over to our Community to see what others are saying!

This article by Simply Wall St is general in nature. We provide commentary based on historical data and analyst forecasts only using an unbiased methodology and our articles are not intended to be financial advice. It does not constitute a recommendation to buy or sell any stock, and does not take account of your objectives, or your financial situation. We aim to bring you long-term focused analysis driven by fundamental data. Note that our analysis may not factor in the latest price-sensitive company announcements or qualitative material. Simply Wall St has no position in any stocks mentioned.
