
Please use a PC Browser to access Register-Tadawul
Get It
Is Paychex (PAYX) Now An Opportunity After A 33% One-Year Share Price Slide?
Paychex, Inc. PAYX | 92.55 | +0.92% |
A Discounted Cash Flow model takes the cash Paychex is expected to generate in the future and discounts those projected cash flows back to today to estimate what the business could be worth right now.
In this 2 Stage Free Cash Flow to Equity model, Paychex last reported trailing twelve month free cash flow of about $2.0b. Analyst and extrapolated projections suggest free cash flow in the range of roughly $2.1b in 2026 and $2.6b by 2028, reaching about $3.8b by 2035 based on Simply Wall St estimates beyond the analyst horizon.
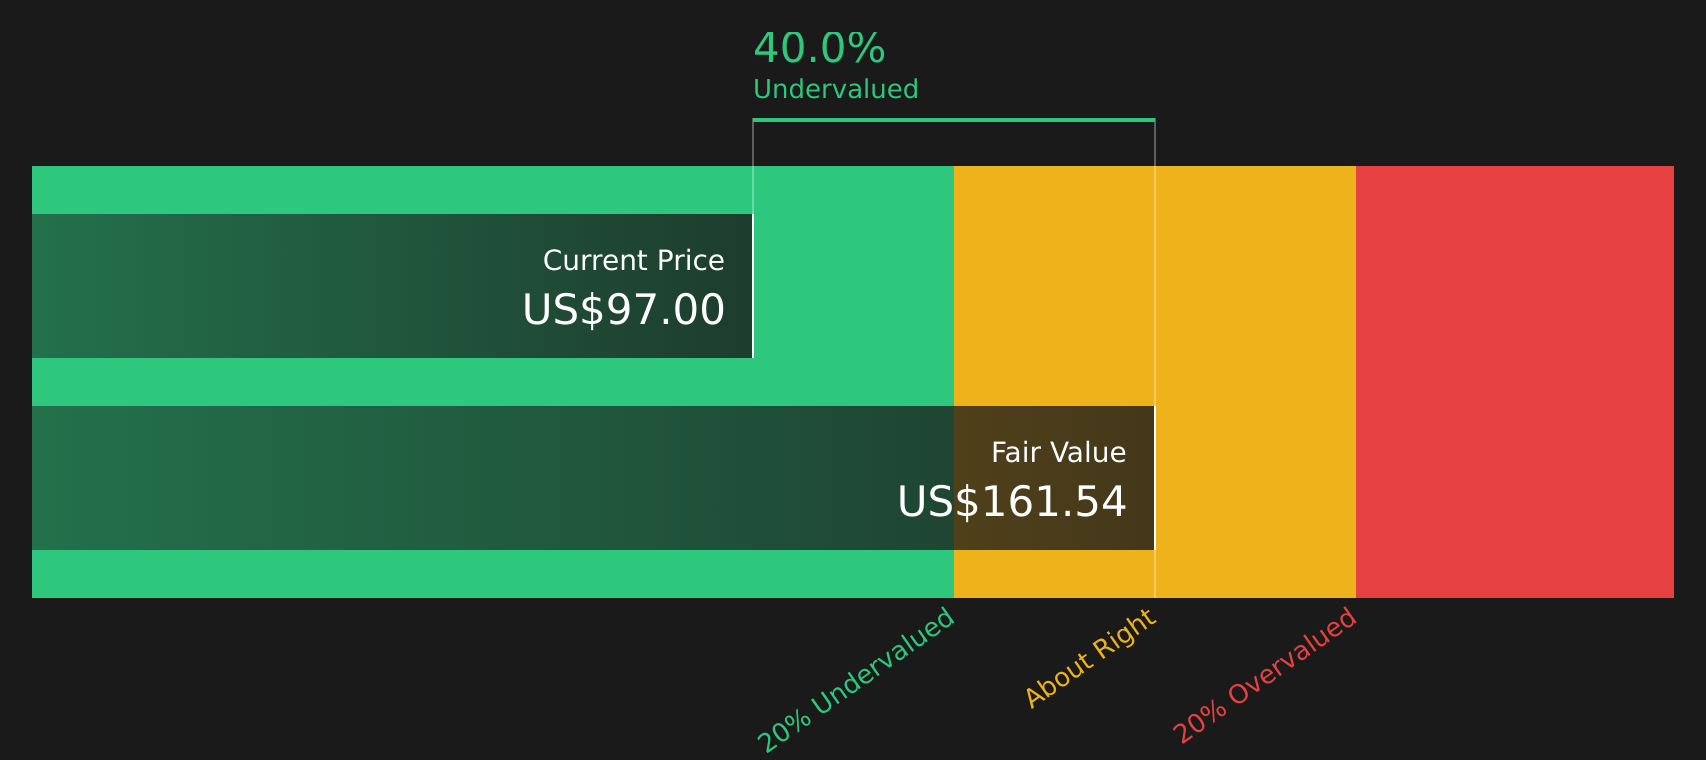
When all those projected cash flows are discounted back and combined with a terminal value, the model arrives at an estimated intrinsic value of US$180.54 per share. Against the recent share price of US$94.00, this implies Paychex trades at a 47.9% discount, so on this DCF view the stock screens as undervalued.
Result: UNDERVALUED
Our Discounted Cash Flow (DCF) analysis suggests Paychex is undervalued by 47.9%. Track this in your watchlist or portfolio, or discover 50 more high quality undervalued stocks.
The P/E ratio is a useful way to look at profitable companies like Paychex because it links what you pay per share to the earnings the business is currently generating. In general, higher growth expectations or lower perceived risk can justify a higher P/E, while slower expected growth or higher risk usually goes with a lower, more conservative P/E.
Paychex is trading on a P/E of 21.15x. That sits above the Professional Services industry average of about 19.90x and close to the peer average of 19.90x, so on simple comparisons you are paying a modest premium for each dollar of earnings. To go a step further, Simply Wall St calculates a proprietary “Fair Ratio” of 27.50x, which reflects the P/E it would expect given factors such as Paychex’s earnings profile, industry, profit margins, market cap and risk characteristics.
This Fair Ratio is more tailored than a basic peer or industry comparison because it attempts to adjust for differences in growth, risk and profitability rather than treating all companies as if they are the same. Set against the current P/E of 21.15x, the Fair Ratio of 27.50x suggests the shares may be pricing in less optimism than this model implies.
Result: UNDERVALUED

P/E ratios tell one story, but what if the real opportunity lies elsewhere? Start investing in legacies, not executives. Discover our 20 top founder-led companies.
Earlier we mentioned that there is an even better way to understand valuation, so let us introduce you to Narratives, which let you connect your view of Paychex’s story to specific assumptions about its future revenue, earnings and margins, then link that forecast to a Fair Value you can compare with today’s price. This all happens within an easy tool on Simply Wall St’s Community page that updates when new news or earnings arrive and can reflect very different perspectives. For example, one investor might build a Narrative around a Fair Value close to the most bullish analyst target of US$160.00, while another might use assumptions that lead to a Fair Value nearer the most cautious target of US$122.00. This gives you a clear sense of how your own story about AI automation, the Paycor relationship and profitability translates into whether Paychex looks expensive, cheap or roughly in line with your expectations.
Do you think there's more to the story for Paychex? Head over to our Community to see what others are saying!

This article by Simply Wall St is general in nature. We provide commentary based on historical data and analyst forecasts only using an unbiased methodology and our articles are not intended to be financial advice. It does not constitute a recommendation to buy or sell any stock, and does not take account of your objectives, or your financial situation. We aim to bring you long-term focused analysis driven by fundamental data. Note that our analysis may not factor in the latest price-sensitive company announcements or qualitative material. Simply Wall St has no position in any stocks mentioned.
