
Please use a PC Browser to access Register-Tadawul
Get It
Is Pediatrix Medical Group (MD) Pricing Look Compelling After Recent Share Price Pullback
Pediatrix Medical Group, Inc. MD | 18.82 | -2.49% |
A Discounted Cash Flow, or DCF, model estimates what a business could be worth today by projecting its future cash flows and discounting them back to the present using a required return.
For Pediatrix Medical Group, the model used is a 2 Stage Free Cash Flow to Equity approach, based on cash flows in US$. The latest twelve month Free Cash Flow is about $264.9 million. Analysts provide explicit forecasts for the next few years, and Simply Wall St then extrapolates cash flows further out, with projected Free Cash Flow in 2035 of about $144.8 million.
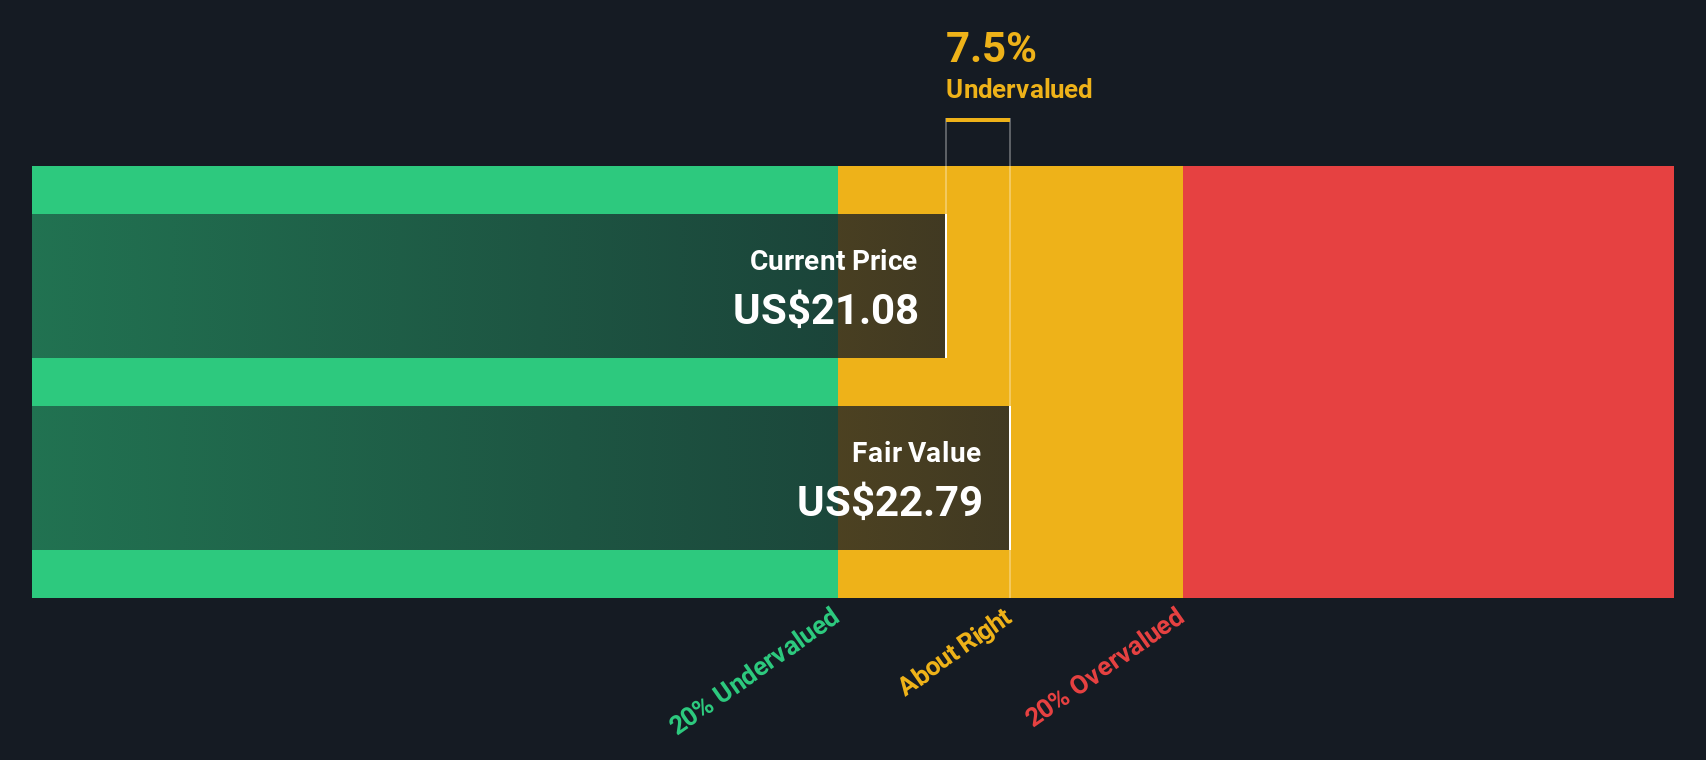
After discounting this stream of cash flows back to today, the DCF model suggests an estimated intrinsic value of about $37.38 per share. Compared to the recent share price of $20.53, this implies the stock is around 45.1% below that DCF estimate, which indicates that Pediatrix Medical Group is trading at a substantial discount to this cash flow based valuation.
Result: UNDERVALUED
Our Discounted Cash Flow (DCF) analysis suggests Pediatrix Medical Group is undervalued by 45.1%. Track this in your watchlist or portfolio, or discover 879 more undervalued stocks based on cash flows.
For profitable companies, the P/E ratio is a useful way to see how much investors are paying for each dollar of earnings. It links directly to what the business is currently earning, so it is a straightforward check on whether the share price looks rich or restrained relative to those profits.
What counts as a "normal" P/E depends on how the market views a company’s growth potential and risk. Higher expected growth or lower perceived risk can justify a higher P/E, while lower growth expectations or higher risk usually point to a lower multiple.
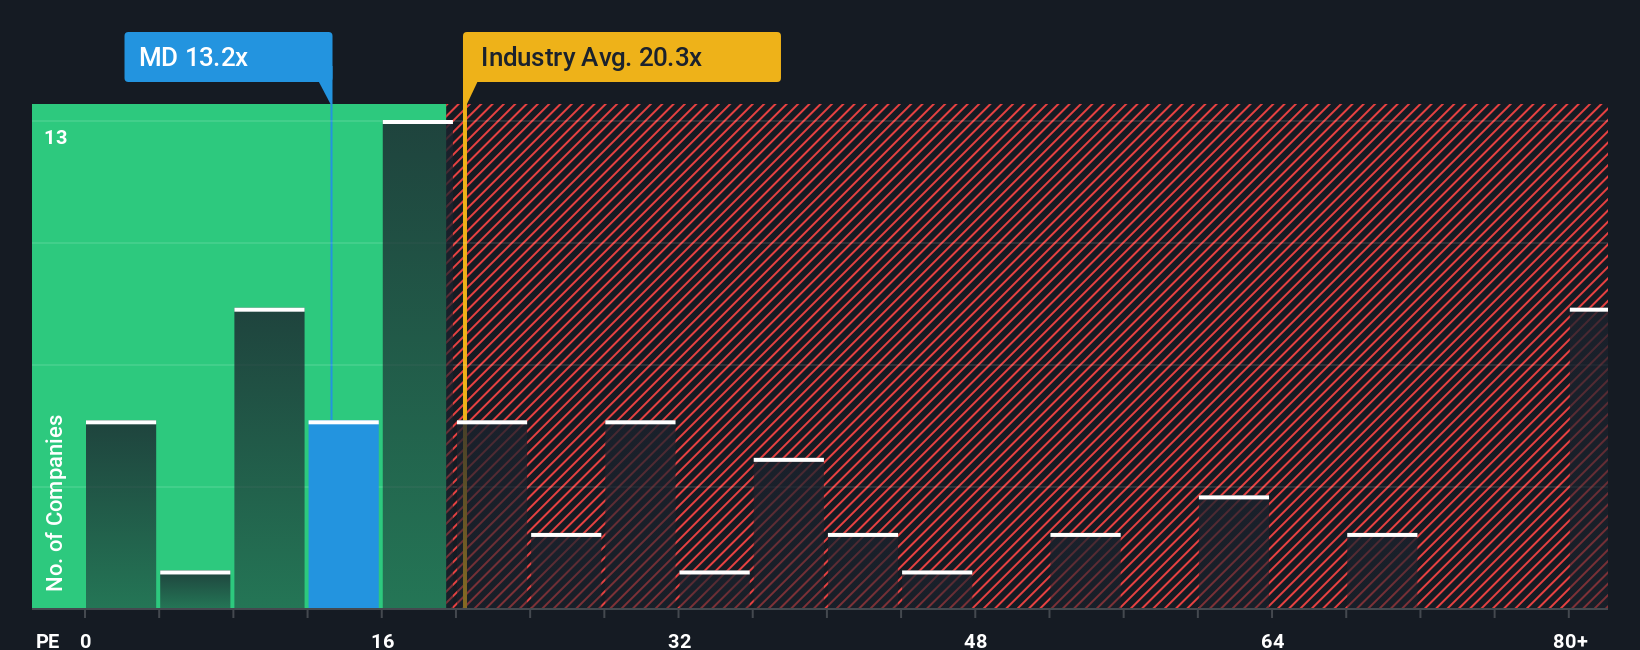
Pediatrix Medical Group currently trades on a P/E of 10.66x. This sits below the wider Healthcare industry average P/E of 22.44x and the peer group average of 77.06x. Simply Wall St also calculates a proprietary “Fair Ratio” of 16.15x for Pediatrix Medical Group. This Fair Ratio reflects factors such as earnings growth, profit margins, industry, market capitalization and company specific risks, which makes it more tailored than a simple comparison to peers or the broad industry.
Comparing the Fair Ratio of 16.15x to the current P/E of 10.66x suggests the shares are pricing in less than this model implies.
Result: UNDERVALUED
P/E ratios tell one story, but what if the real opportunity lies elsewhere? Discover 1425 companies where insiders are betting big on explosive growth.
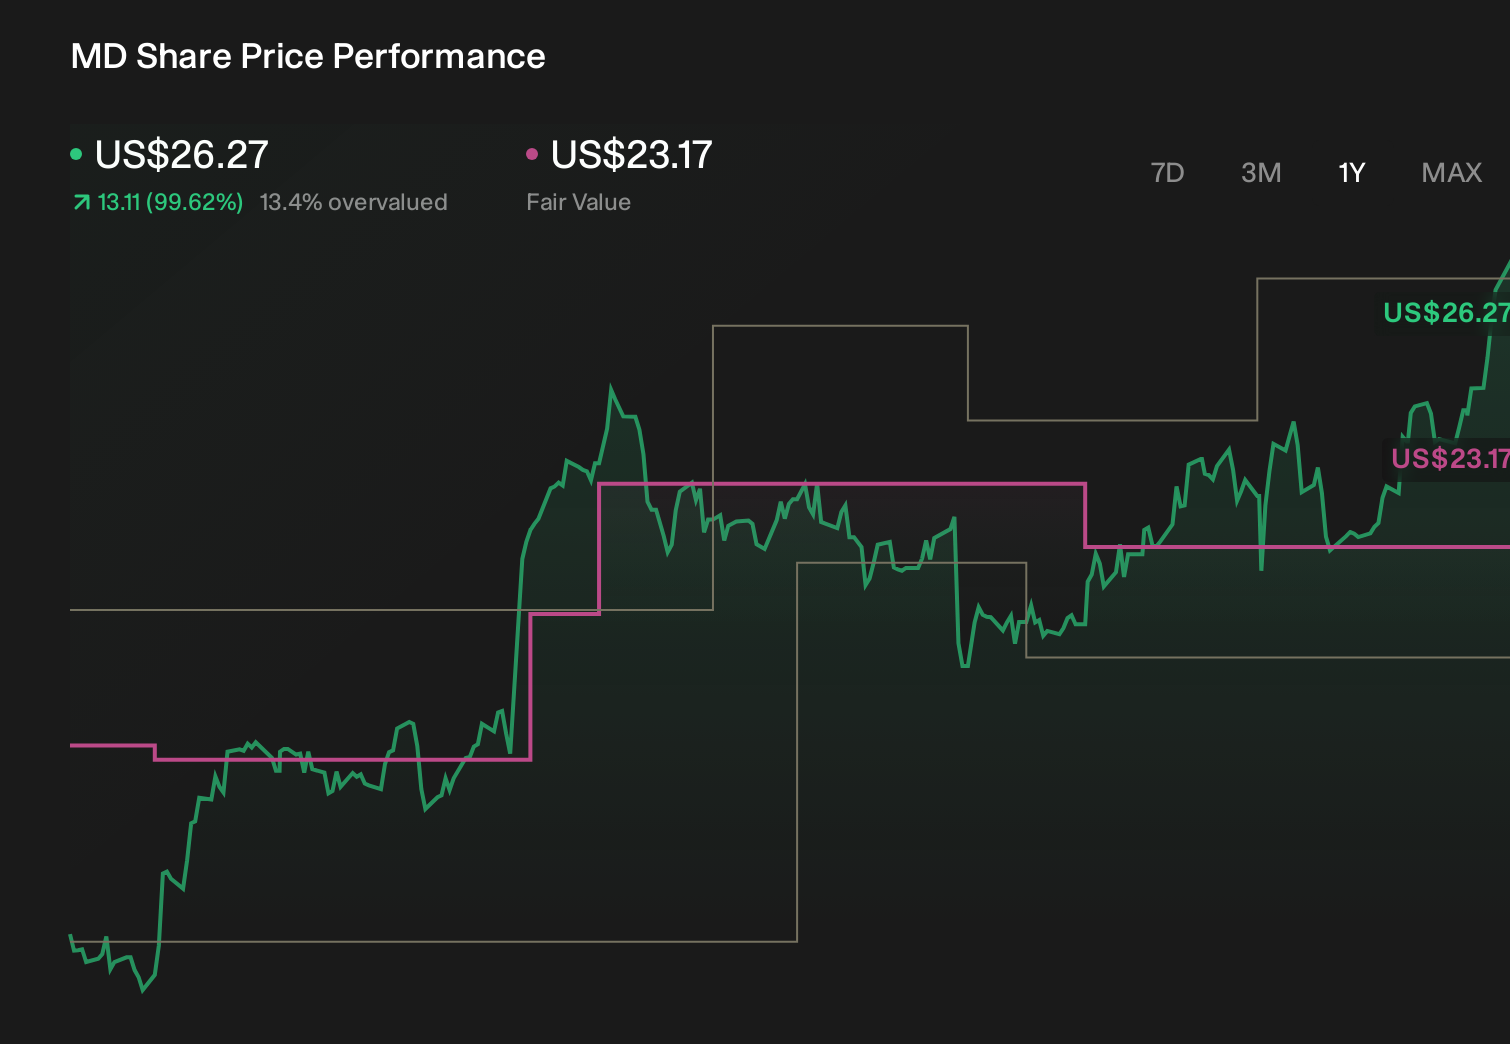
Earlier we mentioned that there is an even better way to understand valuation, so let us introduce you to Narratives. A Narrative is simply your story about a company, where you link your view of its future revenue, earnings and margins to your own fair value estimate instead of only relying on one model or ratio. On Simply Wall St, Narratives live in the Community page and are designed to be easy to use, so you can connect a company’s story to a financial forecast and then to a fair value in a few clear steps. Narratives can support your decision making by helping you compare your Fair Value to the current market price, and they update automatically when new information, such as news or earnings, is added to the platform. For Pediatrix Medical Group, one investor might build a Narrative with a higher fair value based on confidence in specialist healthcare demand, while another might set a much lower fair value if they are more cautious about future margins.
Do you think there's more to the story for Pediatrix Medical Group? Head over to our Community to see what others are saying!
This article by Simply Wall St is general in nature. We provide commentary based on historical data and analyst forecasts only using an unbiased methodology and our articles are not intended to be financial advice. It does not constitute a recommendation to buy or sell any stock, and does not take account of your objectives, or your financial situation. We aim to bring you long-term focused analysis driven by fundamental data. Note that our analysis may not factor in the latest price-sensitive company announcements or qualitative material. Simply Wall St has no position in any stocks mentioned.
