
Please use a PC Browser to access Register-Tadawul
Get It
Is Rivian Automotive (RIVN) Now Attractively Priced After Recent Share Price Swings
Rivian Automotive, Inc. Class A RIVN | 15.53 15.42 | -1.83% -0.71% Pre |
Rivian Automotive scores just 2/6 on our valuation checks. See what other red flags we found in the full valuation breakdown.
A Discounted Cash Flow, or DCF, model takes projected future cash flows and discounts them back to today using a required rate of return. The goal is to translate all those future dollars into a single estimate of what the business might be worth right now.
For Rivian Automotive, the model used is a 2 Stage Free Cash Flow to Equity approach, based on cash flow projections in US$. The latest twelve month free cash flow is a loss of about US$2.19b. Analyst estimates and extrapolations then project free cash flow reaching US$1.99b by 2030, with a path that includes several years of negative cash flow before moving into positive territory.
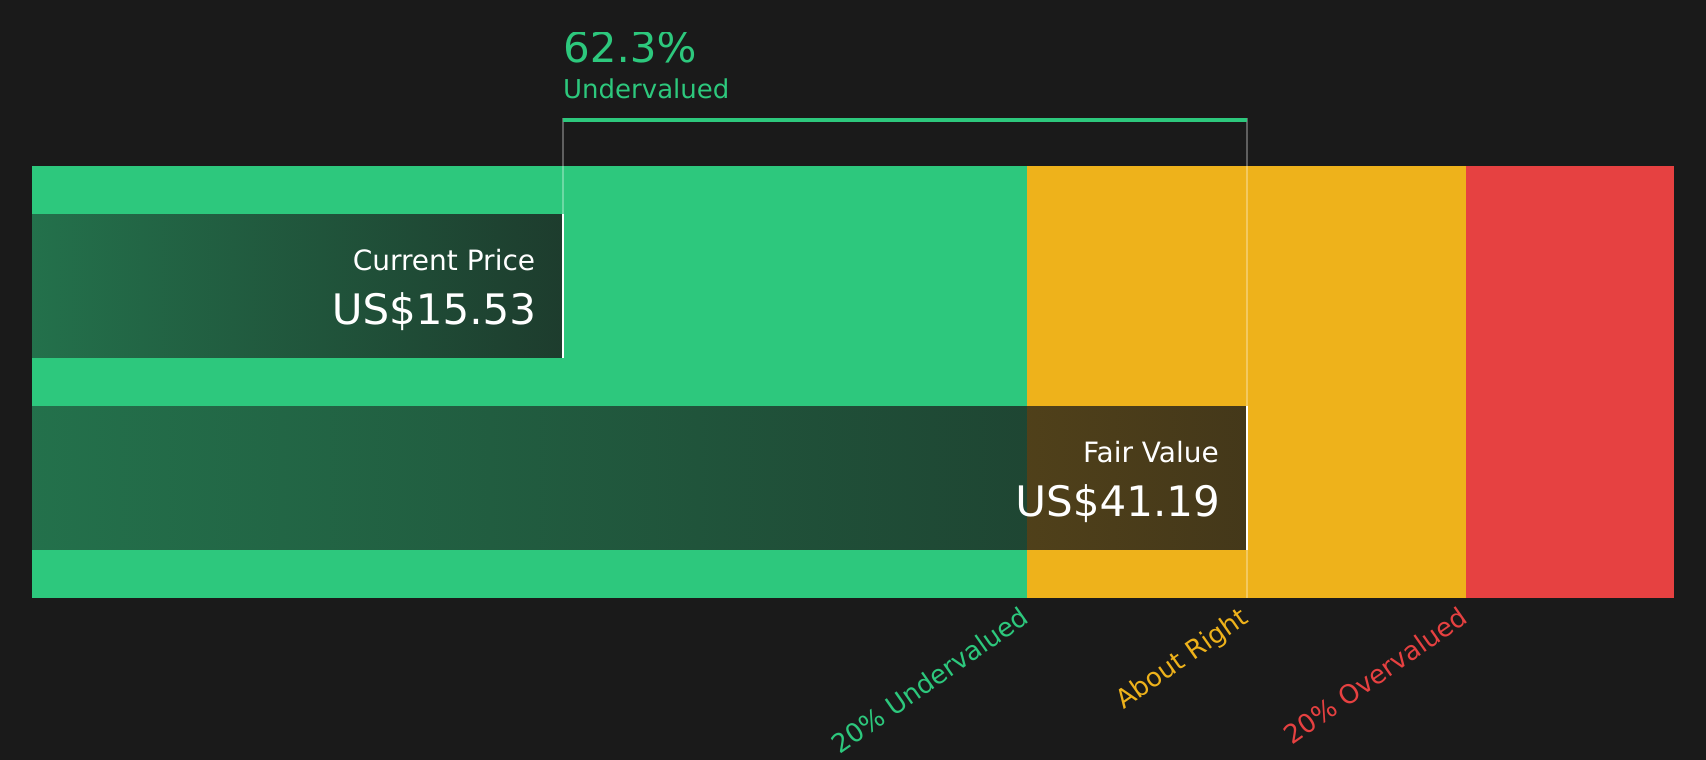
When all these projected cash flows are discounted back and added together, the DCF output points to an estimated intrinsic value of about US$40.62 per share. Compared with the recent share price of US$14.86, this implies the stock screens as around 63.4% undervalued under this method.
Result: UNDERVALUED
Our Discounted Cash Flow (DCF) analysis suggests Rivian Automotive is undervalued by 63.4%. Track this in your watchlist or portfolio, or discover 48 more high quality undervalued stocks.
For companies that are not yet consistently profitable, the P/S ratio is often more useful than P/E because it focuses on revenue rather than earnings that may still be negative or volatile. Investors typically accept a higher or lower P/S ratio depending on what they expect for future growth and how risky they think that revenue stream is, so there is no single "normal" level that fits every business.
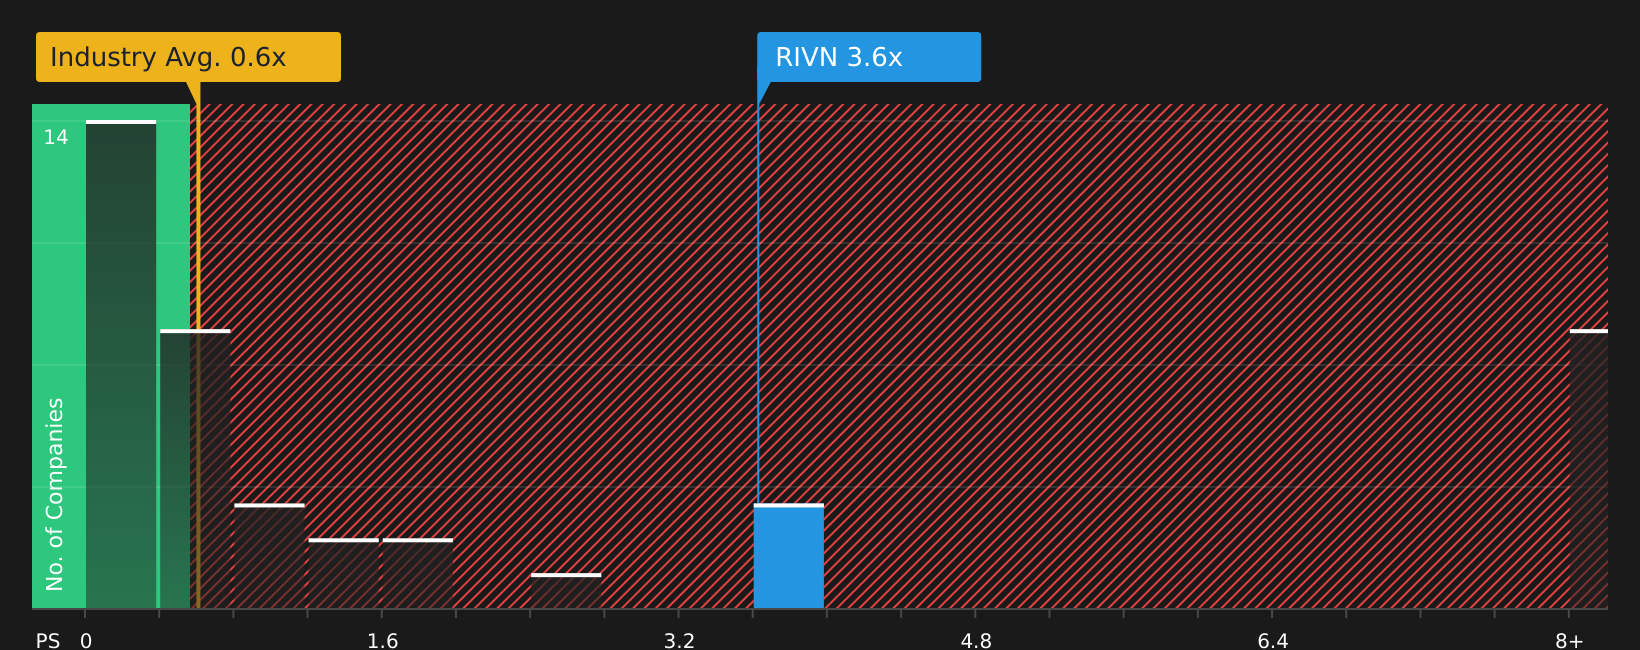
Rivian Automotive currently trades on a P/S ratio of 3.42x. That sits above the Auto industry average of 0.65x and the peer average of 1.09x, which on a simple comparison suggests the market is paying a higher price for each dollar of Rivian's sales. Simply Wall St's Fair Ratio for Rivian is 1.20x, which is its proprietary view of what the P/S should be after accounting for factors like earnings growth estimates, profit margins, industry, market cap and specific risks.
This Fair Ratio can be more informative than a basic peer or industry comparison because it adjusts for differences in business quality and risk profile, rather than assuming all Auto companies deserve similar multiples. Since Rivian's actual 3.42x P/S is above the 1.20x Fair Ratio, the shares screen as overvalued on this measure.
Result: OVERVALUED
P/S ratios tell one story, but what if the real opportunity lies elsewhere? Start investing in legacies, not executives. Discover our 19 top founder-led companies.
Earlier we mentioned that there is an even better way to understand valuation. On Simply Wall St's Community page you can use Narratives, where you connect your view of Rivian Automotive's story to your own revenue, earnings and margin estimates. You can then link those forecasts to a Fair Value and compare that Fair Value to the current share price. The platform updates the numbers automatically when new news or earnings arrive. This is why one Rivian Narrative might assume a Fair Value of about US$10 per share, while another sees closer to US$25, reflecting how different investors can look at the same company and reach very different conclusions.
For Rivian Automotive, we will make it really easy for you with previews of two leading Rivian Automotive Narratives:
Together they bracket a reasonable range of outcomes, so you can sense check where your own view sits between them.
🐂 Rivian Automotive Bull CaseFair value: US$16.96 per share
Gap to fair value: current price is about 12.4% below this narrative fair value
Assumed revenue growth: 40.76% a year
Fair value: US$10.00 per share
Gap to fair value: current price is about 48.6% above this narrative fair value
Assumed revenue growth: 24.82% a year
Do you think there's more to the story for Rivian Automotive? Head over to our Community to see what others are saying!

This article by Simply Wall St is general in nature. We provide commentary based on historical data and analyst forecasts only using an unbiased methodology and our articles are not intended to be financial advice. It does not constitute a recommendation to buy or sell any stock, and does not take account of your objectives, or your financial situation. We aim to bring you long-term focused analysis driven by fundamental data. Note that our analysis may not factor in the latest price-sensitive company announcements or qualitative material. Simply Wall St has no position in any stocks mentioned.
