
Please use a PC Browser to access Register-Tadawul
Get It
Is Teva Pharmaceutical Industries (TEVA) Still Attractive After A 92% One-Year Share Price Surge
Teva Pharmaceutical Industries Limited Sponsored ADR TEVA | 33.86 | +0.27% |
Teva Pharmaceutical Industries scores just 2/6 on our valuation checks. See what other red flags we found in the full valuation breakdown.
A Discounted Cash Flow, or DCF, model estimates what a business could be worth by projecting its future cash flows and then discounting those back to today’s value. It is essentially asking what all those future $ cash flows are worth in today’s terms.
For Teva Pharmaceutical Industries, the model used is a 2 Stage Free Cash Flow to Equity approach, based on cash flow projections in $. The latest twelve month free cash flow is reported at about $1.12b. Analysts provide explicit forecasts out to 2030, with projected free cash flow of $4.05b by the end of that year. Beyond that, Simply Wall St extrapolates further annual free cash flows up to 2035, using gradually rising estimates, all expressed in the billions of dollars.
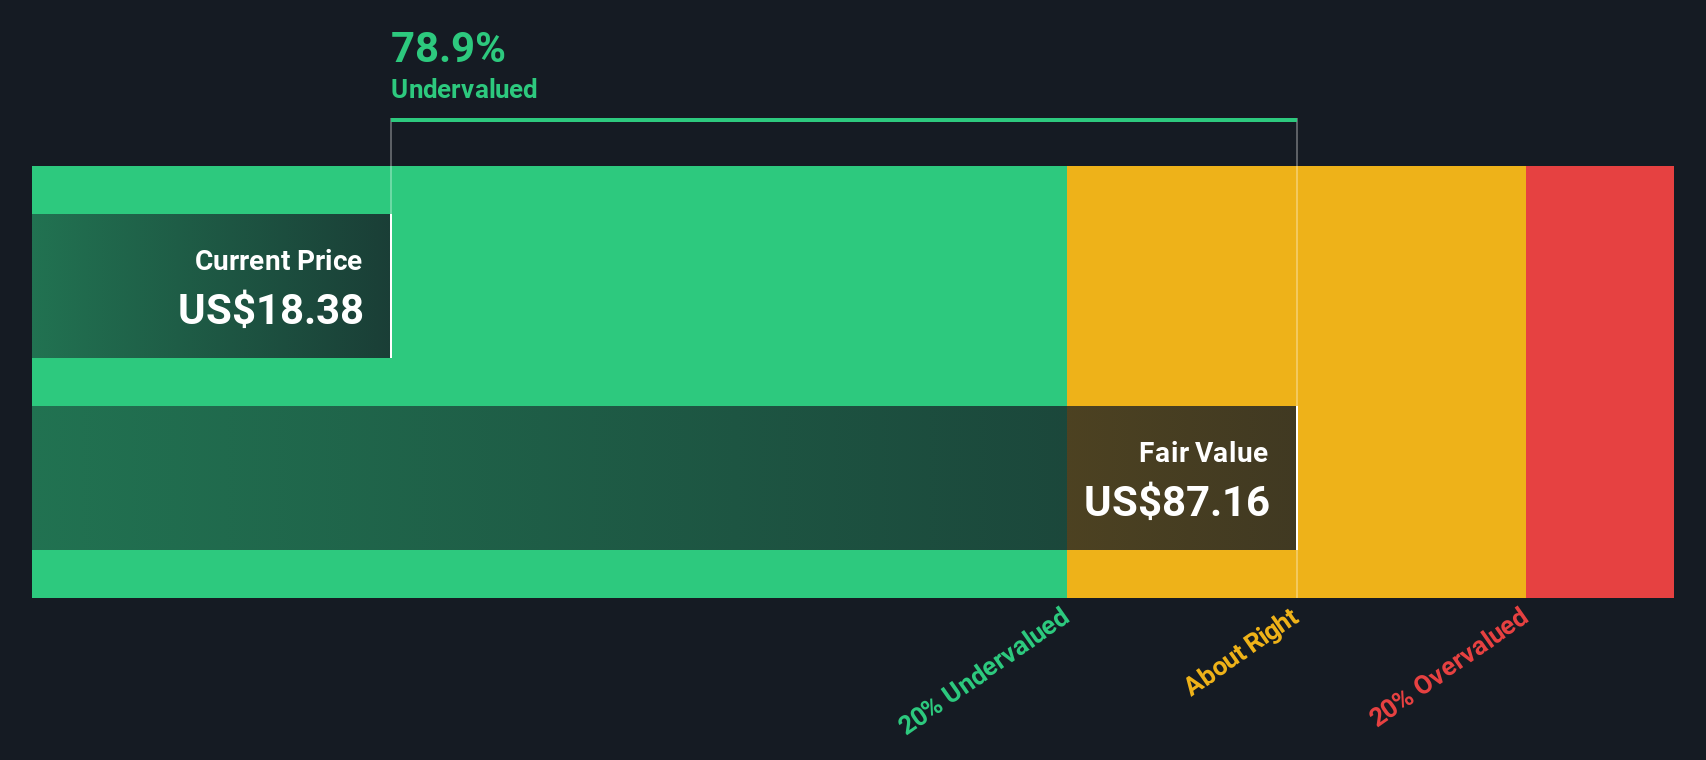
When these forecast and extrapolated cash flows are discounted back to today using the DCF method, the estimated intrinsic value comes out at US$57.72 per share. Compared with the current share price of US$34.08, this implies an intrinsic discount of about 41.0%. This indicates that the shares are currently priced below this DCF estimate.
Result: UNDERVALUED
Our Discounted Cash Flow (DCF) analysis suggests Teva Pharmaceutical Industries is undervalued by 41.0%. Track this in your watchlist or portfolio, or discover 868 more undervalued stocks based on cash flows.
For profitable companies, the P/E ratio is a widely used way to think about valuation because it links what you pay for the stock to the earnings the business is currently generating. You are essentially asking how many dollars you are paying today for each dollar of earnings.
What counts as a normal or fair P/E depends on how investors view the company’s growth potential and risk. Higher expected growth or lower perceived risk can justify a higher P/E, while lower growth or higher risk usually lines up with a lower P/E.
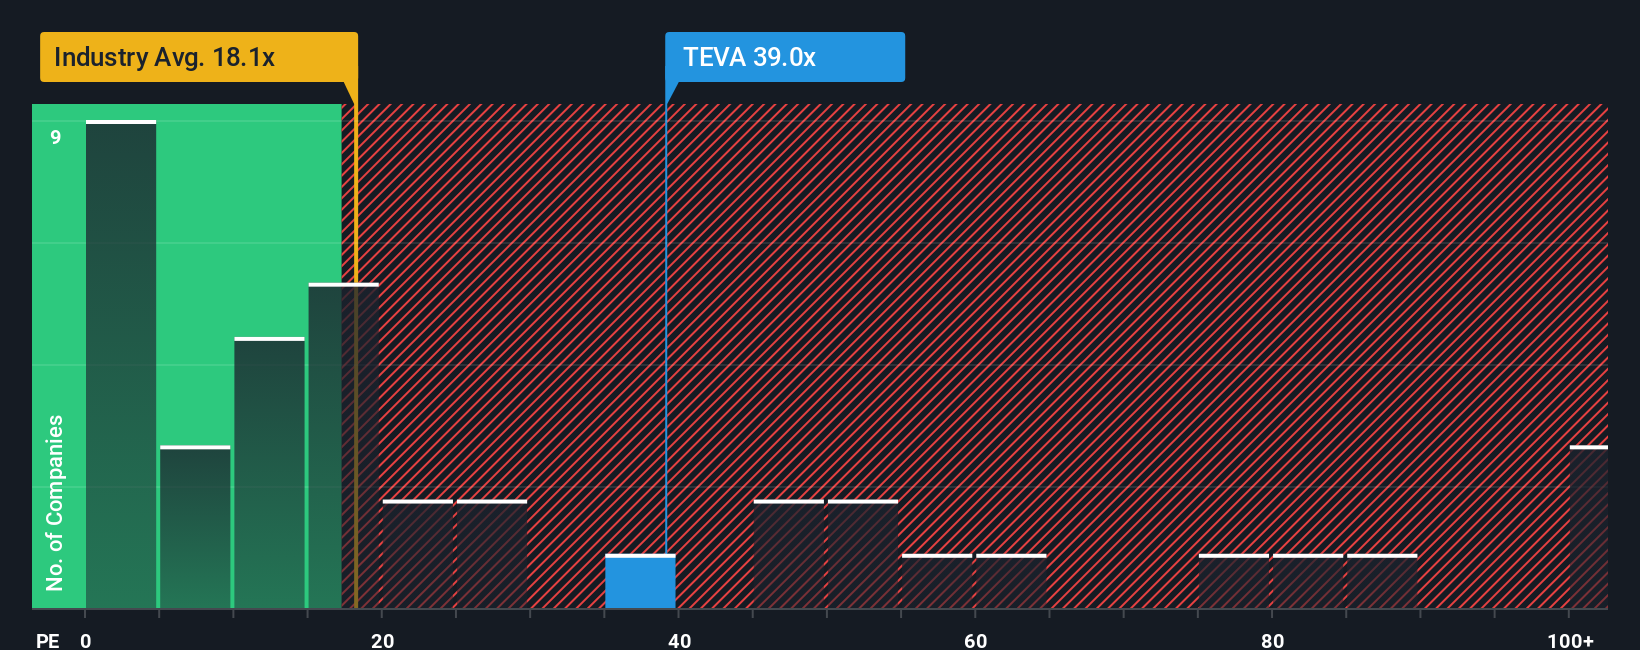
Teva Pharmaceutical Industries is trading on a P/E of 27.7x. That sits above the Pharmaceuticals industry average of about 20.4x and also above the peer group average of 19.5x. This suggests the market is currently putting a higher earnings multiple on Teva than on many of its peers.
Simply Wall St’s Fair Ratio is a proprietary P/E estimate based on factors such as earnings growth, industry, profit margin, market cap and company specific risks. Because it blends these company attributes instead of relying only on simple comparisons, it can offer a more tailored view than a straight peer or industry average.
For Teva, the Fair Ratio is 25.4x, which is below the actual P/E of 27.7x, indicating the shares look overvalued on this measure.
Result: OVERVALUED
P/E ratios tell one story, but what if the real opportunity lies elsewhere? Discover 1417 companies where insiders are betting big on explosive growth.
Earlier we mentioned that there is an even better way to understand valuation, so let us introduce you to Narratives, a simple way to connect your view of Teva Pharmaceutical Industries with concrete numbers like fair value, future revenue, earnings and margins. A Narrative is your story about the company, turned into a financial forecast that leads to a fair value, so you can easily compare that value with today’s share price and decide whether you see Teva as attractive, fairly priced or expensive. On Simply Wall St, Narratives sit inside the Community page, where millions of investors can build and share their own views without needing complex models. Each Narrative updates automatically when fresh information such as news or earnings is added, so your fair value view stays aligned with the latest data. For Teva, one investor might build a cautious Narrative with modest revenue and margin assumptions, while another might use more optimistic inputs, and those two fair values could sit far apart even though they are both using the same company.
Do you think there's more to the story for Teva Pharmaceutical Industries? Head over to our Community to see what others are saying!
This article by Simply Wall St is general in nature. We provide commentary based on historical data and analyst forecasts only using an unbiased methodology and our articles are not intended to be financial advice. It does not constitute a recommendation to buy or sell any stock, and does not take account of your objectives, or your financial situation. We aim to bring you long-term focused analysis driven by fundamental data. Note that our analysis may not factor in the latest price-sensitive company announcements or qualitative material. Simply Wall St has no position in any stocks mentioned.
