
Please use a PC Browser to access Register-Tadawul
Get It
Is There Still Opportunity in WNS After 60% Rally and Fresh Digital Outsourcing Deals?
WNS (Holdings) Limited Sponsored ADR WNS | 76.48 | Delist |
If you have ever owned WNS (Holdings) or followed it from the sidelines, you are already familiar with the rollercoaster that is its stock price. Lately, the ride has tilted more upward than not. Shares closed most recently at $75.63, steadily rising with a 59.9% jump so far this year and 31.5% over the past twelve months. That is a dramatic level of outperformance that has attracted plenty of new fans and a few skeptics questioning whether the best gains are now behind us.
Shorter-term gains have been less striking, with just 0.3% growth in the past week and 0.8% in the last month. But the remarkable year-to-date trajectory has come as the broader outsourcing and digital services sector has gained momentum as investors have increasingly sought companies able to deliver efficiencies for clients as global business routines are reshaped. However, the longer three- and five-year performance paints a more nuanced picture, with an 8.8% dip over three years but respectable 19.0% growth across five years.
So, is WNS (Holdings) fairly valued at these levels? Here is one quick metric: by applying six valuation checks that focus on earnings, cash flow, and the company’s financial fundamentals, WNS scores a 4 out of 6 for being undervalued. That is a sign there could be more upside hiding under the surface; but like all numbers in investing, context and perspective are everything. Let’s dig deeper into the main valuation approaches and, before we’re done, look at an even better way to assess whether WNS still offers compelling value or if the stock is due for a pause.
WNS (Holdings) delivered 31.5% returns over the last year. See how this stacks up to the rest of the Professional Services industry.A Discounted Cash Flow (DCF) model estimates a company's true value by projecting its future cash flows and discounting those amounts back to today's dollars. This backward calculation aims to answer what the business is really worth based on its underlying financial strength, not just market sentiment.
For WNS (Holdings), the current Free Cash Flow sits at $161 million. Analysts forecast steady growth, expecting Free Cash Flow to reach $214 million by 2028. Beyond these direct forecasts, Simply Wall St extrapolates the company’s cash flows further into the future, with projections reaching roughly $309 million by 2035. This method gives a longer-term view, though with greater uncertainty in the farther-out years.
When all these future cash flows are discounted back to the present, the DCF model calculates an intrinsic fair value for WNS at $77.65 per share. Compared to the current market price of $75.63, the stock appears about 2.6% undervalued according to this approach. That discount is slim, and it suggests the current price already reflects much of WNS (Holdings)’s long-term potential.
Result: ABOUT RIGHT
Head to the Valuation section of our Company Report for more details on how we arrive at this Fair Value for WNS (Holdings).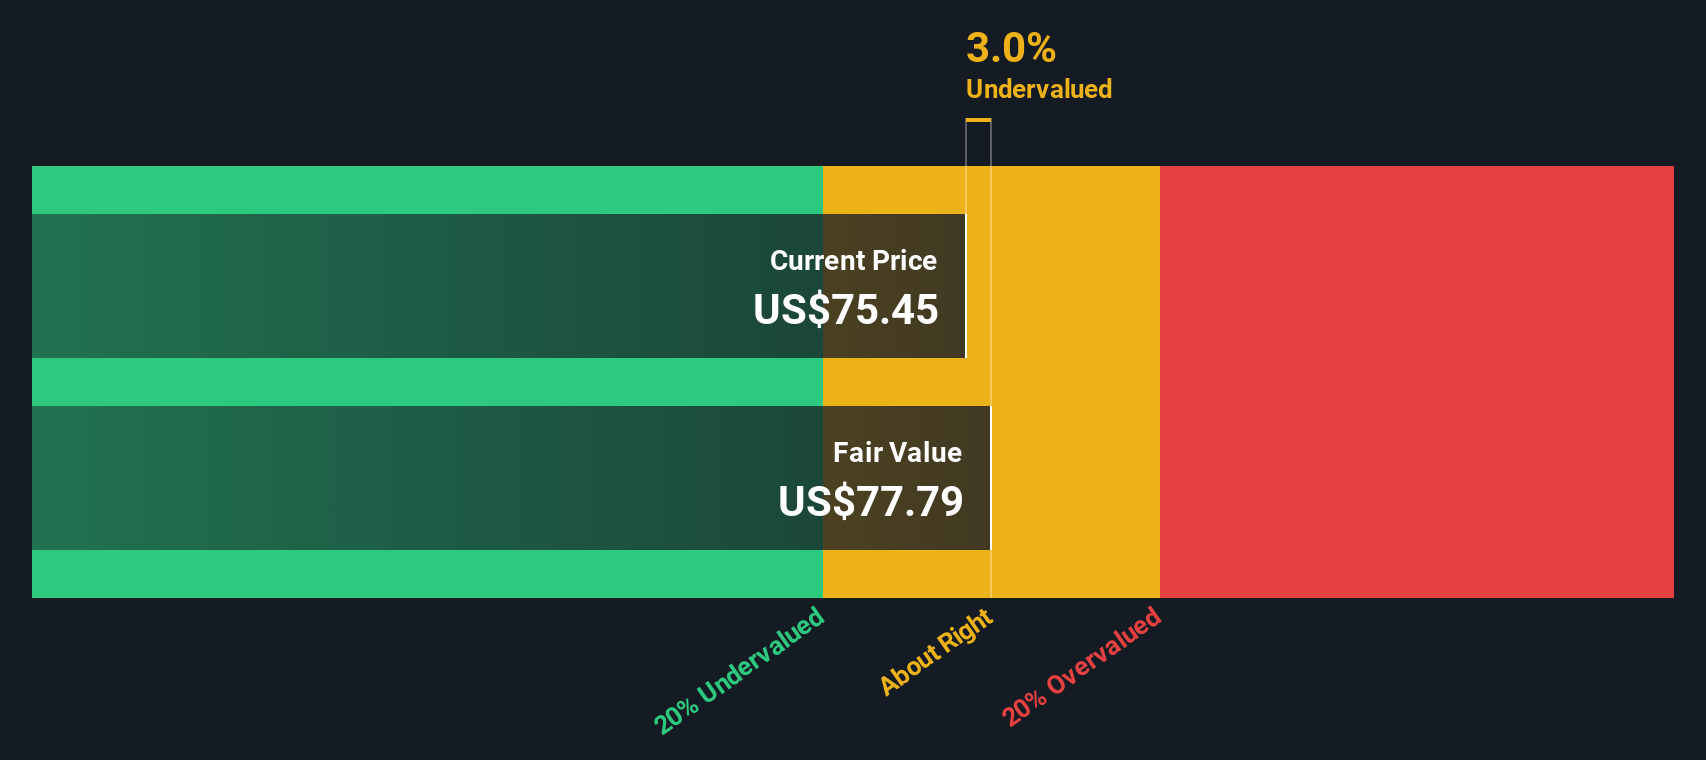
The Price-to-Earnings (PE) ratio is a leading valuation metric for profitable companies like WNS (Holdings) because it directly relates a company's share price to its earnings per share, providing a common yardstick for comparing value between firms. In simple terms, a lower PE can indicate more affordability, but it is important to account for factors like anticipated growth and risk, which can justify a higher or lower "normal" PE for different businesses.
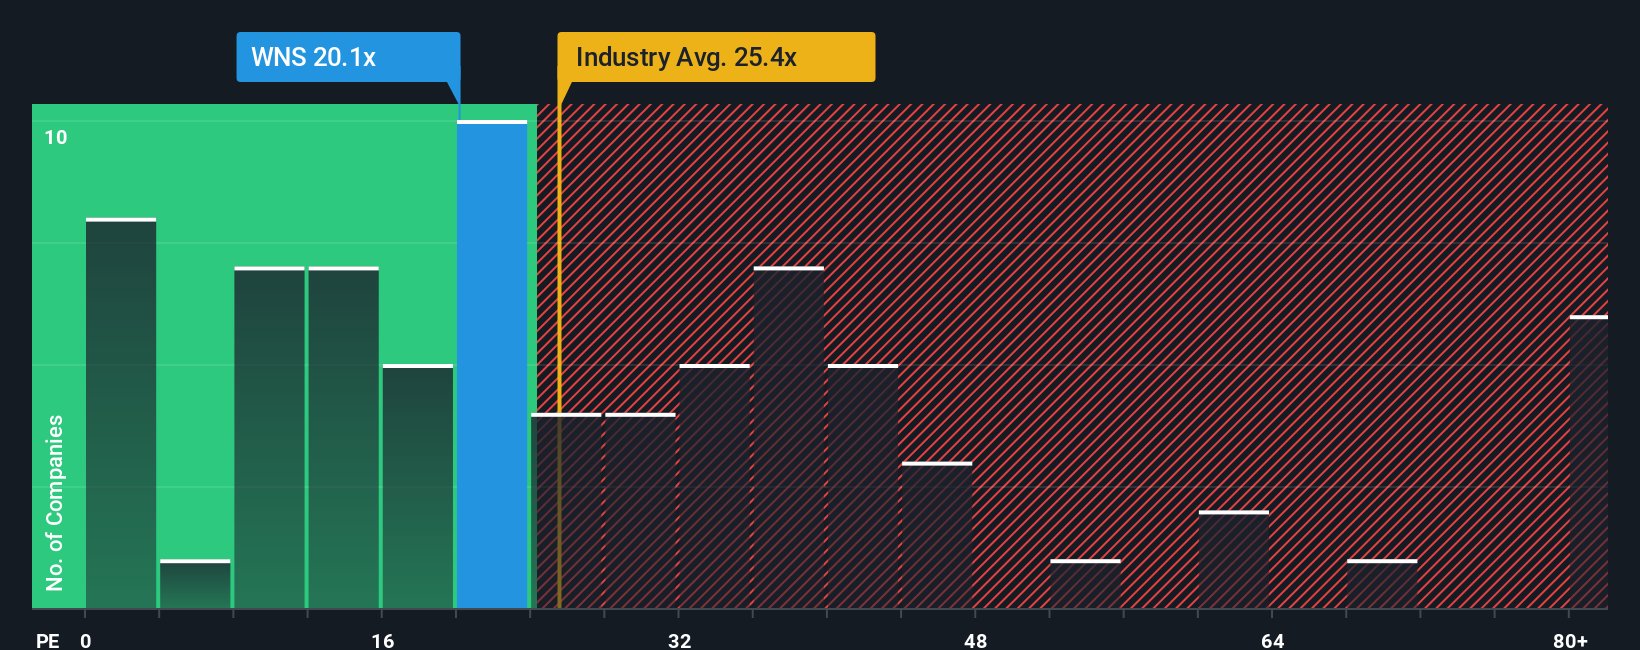
WNS (Holdings) trades at a PE of 19.9x, which is well below the industry average of 27.0x and its peer group average of 32.0x. While these numbers suggest that the stock might be cheap compared to competitors, simply comparing multiples can be misleading if you do not account for a company’s specific earnings growth outlook, profit margins, or risk profile. That is where the Simply Wall St Fair Ratio comes in.
The Fair Ratio, calculated as 22.2x for WNS (Holdings), considers not just industry norms and peer groups but also unique company metrics such as profit margins, growth expectations, market capitalization, and sector-specific risks. This tailored benchmark offers a much clearer picture of what is justified for the stock, more so than broad comparisons alone.
With the actual PE (19.9x) coming in just under the Fair Ratio (22.2x), WNS (Holdings) is trading very close to its fundamental value based on earnings metrics.
Result: ABOUT RIGHT
Earlier, we mentioned that there is an even better way to understand valuation, so let’s introduce you to Narratives. A Narrative is a simple, yet powerful way to capture your investment perspective by telling the story behind the numbers. Narratives connect your expectations for a company’s future revenue, earnings, and margins to your view of its fair value. They link these personal forecasts and reasoning together, so you can see exactly how your view translates to a buy, hold, or sell decision by comparing your estimated Fair Value to today’s Price.
Available and easy to use on Simply Wall St’s Community page, Narratives are tools trusted by millions of investors. When key news or results are published, Narratives update automatically to keep your decision-making dynamic and relevant. For example, some WNS (Holdings) Narratives forecast a fair value as high as $88.48 based on improved automation and margins, while others see fair value as low as $76.2 if growth and margins are pressured. Narratives let you easily compare these perspectives, explore your own scenarios, and make better-informed decisions with confidence.
Do you think there's more to the story for WNS (Holdings)? Create your own Narrative to let the Community know!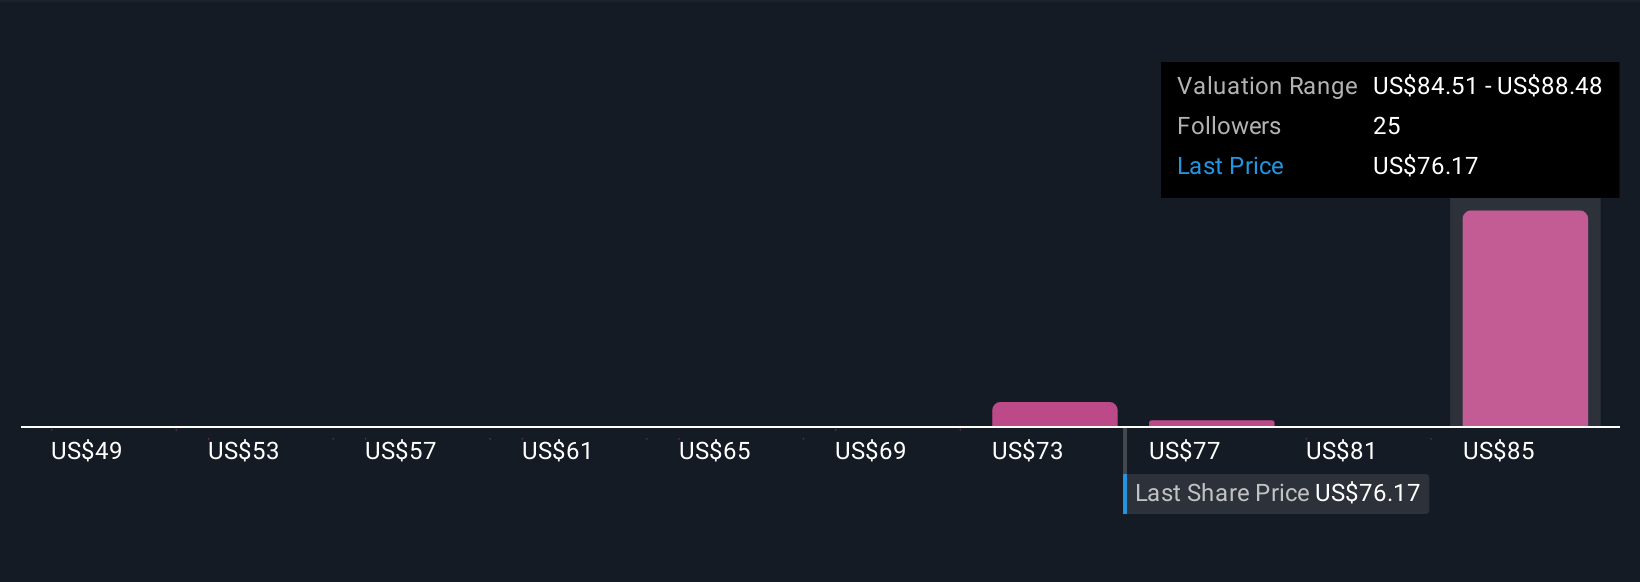
This article by Simply Wall St is general in nature. We provide commentary based on historical data and analyst forecasts only using an unbiased methodology and our articles are not intended to be financial advice. It does not constitute a recommendation to buy or sell any stock, and does not take account of your objectives, or your financial situation. We aim to bring you long-term focused analysis driven by fundamental data. Note that our analysis may not factor in the latest price-sensitive company announcements or qualitative material. Simply Wall St has no position in any stocks mentioned.
