
Please use a PC Browser to access Register-Tadawul
Get It
Is Winnebago Industries (WGO) Pricing Too Rich After Its Recent 30% Monthly Jump
Winnebago Industries, Inc. WGO | 46.82 | +1.85% |
Winnebago Industries scores just 0/6 on our valuation checks. See what other red flags we found in the full valuation breakdown.
A Discounted Cash Flow, or DCF, model looks at the cash Winnebago Industries is expected to generate in the future and then discounts those projected cash flows back to today to estimate what the business might be worth now.
For Winnebago Industries, the model uses a 2 Stage Free Cash Flow to Equity approach. The latest trailing twelve month free cash flow is about $124.7 million. Analysts provide explicit forecasts out to 2027, including an estimate of about $69.4 million in free cash flow in 2027, and Simply Wall St then extrapolates cash flows further out to 2035 using its own assumptions.
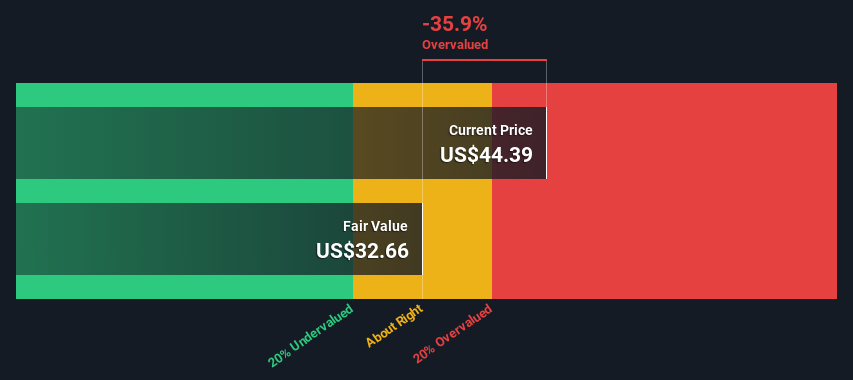
When all of those projected cash flows are discounted back to today, the model arrives at an estimated intrinsic value of about $22.72 per share. Compared with a current share price around $46.65, the DCF output suggests the stock is 105.4% above this estimate. On this specific cash flow based approach, it screens as overvalued.
Result: OVERVALUED
Our Discounted Cash Flow (DCF) analysis suggests Winnebago Industries may be overvalued by 105.4%. Discover 869 undervalued stocks or create your own screener to find better value opportunities.
For a profitable company like Winnebago Industries, the P/E ratio is a straightforward way to relate what you pay for each share to the earnings that business is currently generating. It is a quick sense check of how much investors are paying today for each dollar of earnings.
What counts as a reasonable P/E depends on how the market views the company’s growth prospects and risk. Higher expected growth or lower perceived risk can support a higher “normal” P/E, while slower growth or higher risk usually goes with a lower one.
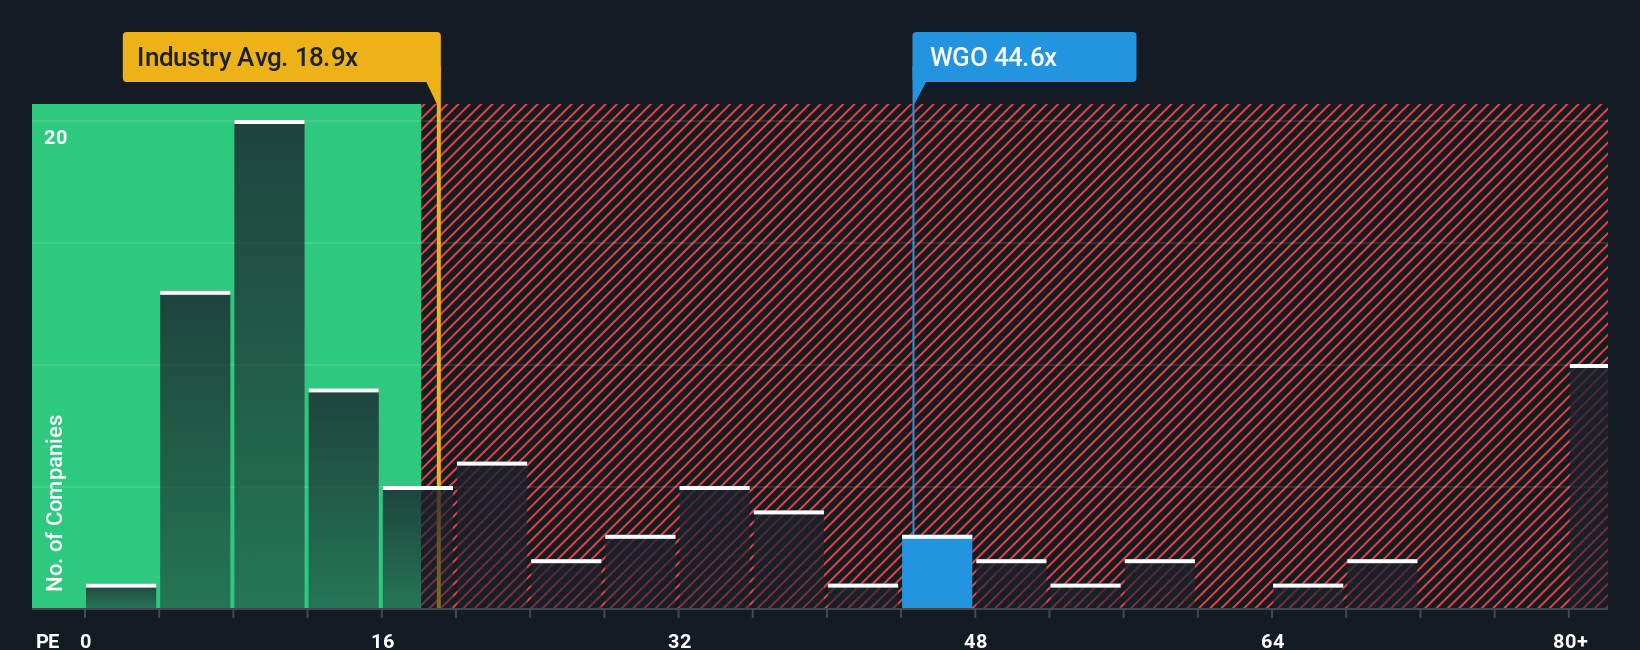
Winnebago Industries currently trades on a P/E of 36.17x. That sits above the Auto industry average of 17.93x and above the peer average of 15.93x. Simply Wall St’s “Fair Ratio” for Winnebago Industries is 24.20x, which is its view of the P/E you might expect given factors such as earnings growth, profit margins, industry, market cap and company specific risks.
This Fair Ratio can be more tailored than a simple comparison with peers or the broad industry because it brings all of those company specific inputs together in one figure. Compared with the current P/E of 36.17x, the Fair Ratio of 24.20x suggests the shares are pricing in richer terms than this framework would imply.
Result: OVERVALUED
P/E ratios tell one story, but what if the real opportunity lies elsewhere? Discover 1411 companies where insiders are betting big on explosive growth.
Earlier we mentioned that there is an even better way to understand valuation, so let us introduce you to Narratives. These are simply your story about a company, linked directly to your own numbers for fair value, future revenue, earnings and margins.
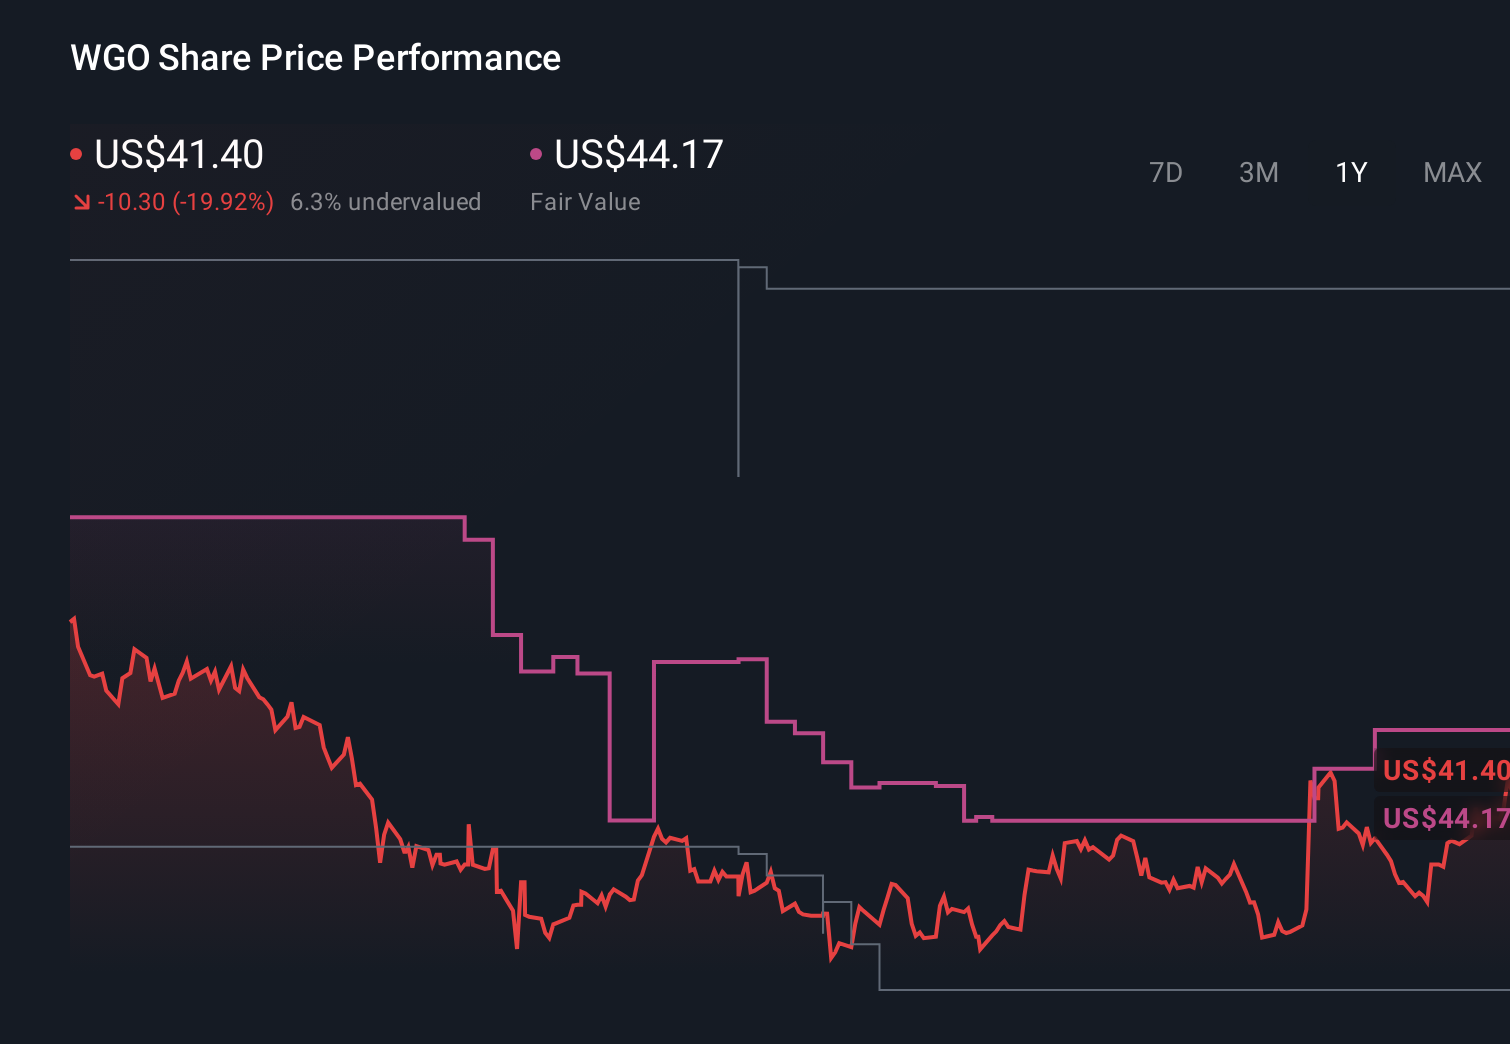
On Simply Wall St, within the Community page that millions of investors use, a Narrative connects how you see Winnebago Industries as a business to a clear financial forecast and then to a fair value per share. You can then compare that Fair Value with the current Price and decide whether the stock looks attractive or expensive on your terms.
Narratives are easy to update, and the platform refreshes them as new information like earnings reports or news comes in. Your view is not frozen in time but adjusts as the story and the numbers change.
For Winnebago Industries, one investor might build a Narrative that assumes a relatively low fair value and cautious revenue and margin assumptions. Another might set a much higher fair value based on more optimistic expectations, and both views can sit side by side for you to compare.
Do you think there's more to the story for Winnebago Industries? Head over to our Community to see what others are saying!
This article by Simply Wall St is general in nature. We provide commentary based on historical data and analyst forecasts only using an unbiased methodology and our articles are not intended to be financial advice. It does not constitute a recommendation to buy or sell any stock, and does not take account of your objectives, or your financial situation. We aim to bring you long-term focused analysis driven by fundamental data. Note that our analysis may not factor in the latest price-sensitive company announcements or qualitative material. Simply Wall St has no position in any stocks mentioned.
