
Please use a PC Browser to access Register-Tadawul
Get It
Is XPeng (NYSE:XPEV) Still Attractive After Its Strong Three Year Share Price Surge?
XPENG INC. XPEV | 20.09 19.86 | +0.60% -1.14% Pre |
XPeng scores just 2/6 on our valuation checks. See what other red flags we found in the full valuation breakdown.
A Discounted Cash Flow, or DCF, model takes estimates of the cash XPeng could generate in the future and discounts them back to what they might be worth today, using a required rate of return. It is essentially asking what those future CN¥ cash flows are worth in present terms.
XPeng currently has last twelve month free cash flow of about CN¥5.1b outflow, so the model assumes conditions change over time and uses a 2 Stage Free Cash Flow to Equity framework. Analysts provide forecasts out to 2027, with projected free cash flow of CN¥10.5b in that year. Simply Wall St then extrapolates further, with estimates reaching around CN¥20.1b in 2035, all expressed in CN¥ and then discounted back over ten years.
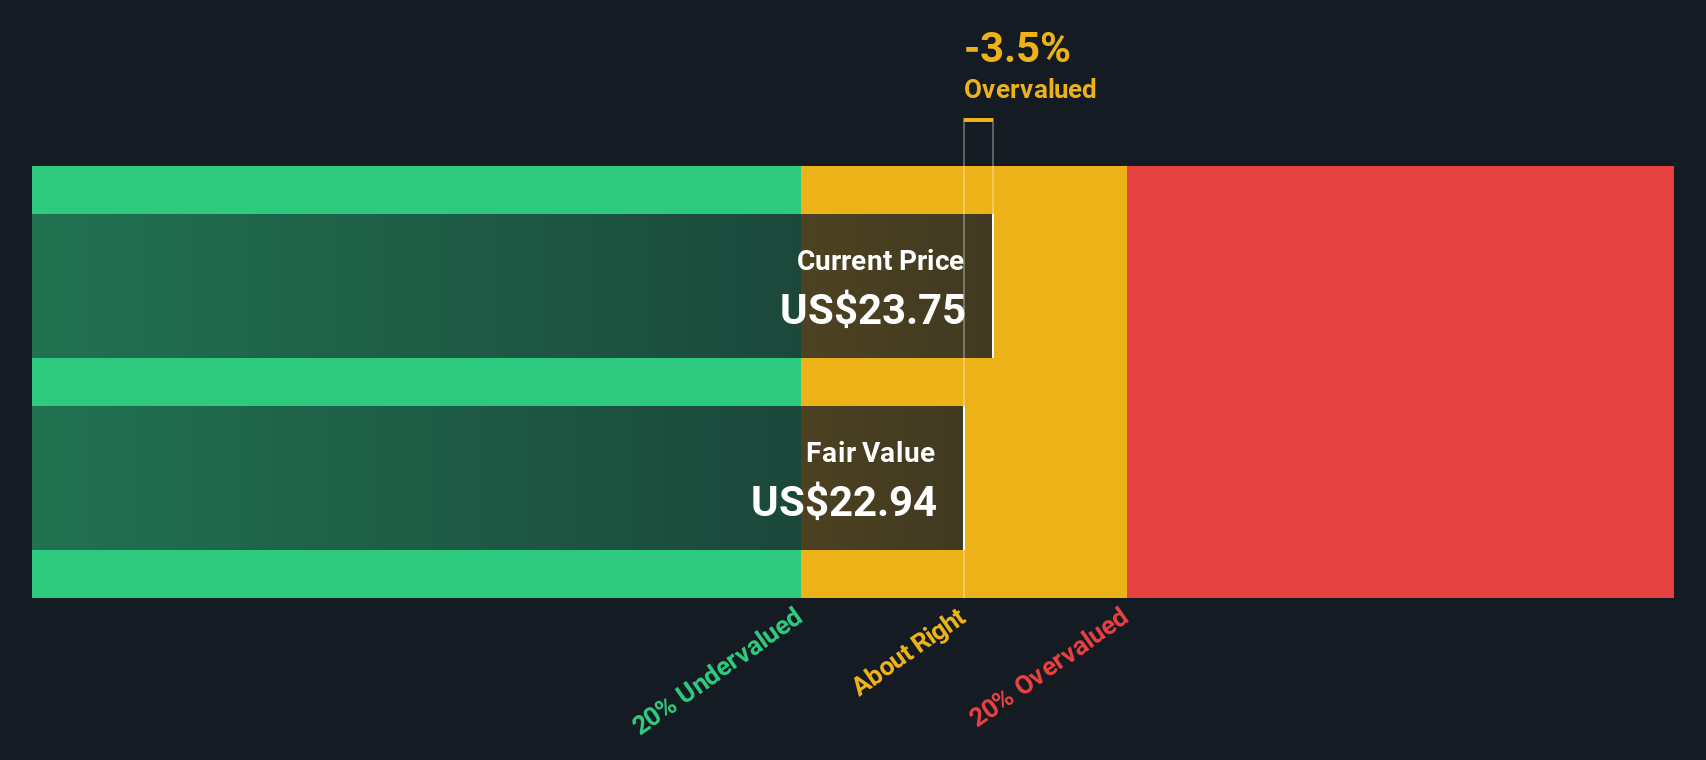
Putting those discounted CN¥ cash flows together results in an estimated intrinsic value of US$24.92 per share, compared with the recent share price of US$20.52. That implies XPeng is trading at about a 17.7% discount to this DCF estimate.
Result: UNDERVALUED
Our Discounted Cash Flow (DCF) analysis suggests XPeng is undervalued by 17.7%. Track this in your watchlist or portfolio, or discover 876 more undervalued stocks based on cash flows.
For a company where earnings can be volatile or not yet a key anchor, the P/S ratio is often a cleaner way to compare what investors are paying for each dollar of revenue. It strips out accounting noise around profits and focuses on the top line that XPeng is generating today.
What investors are willing to pay on a P/S multiple usually reflects a mix of growth expectations and risk. Higher expected growth or lower perceived risk often support a higher “normal” P/S, while slower growth or higher risk tend to pull that “normal” level down.
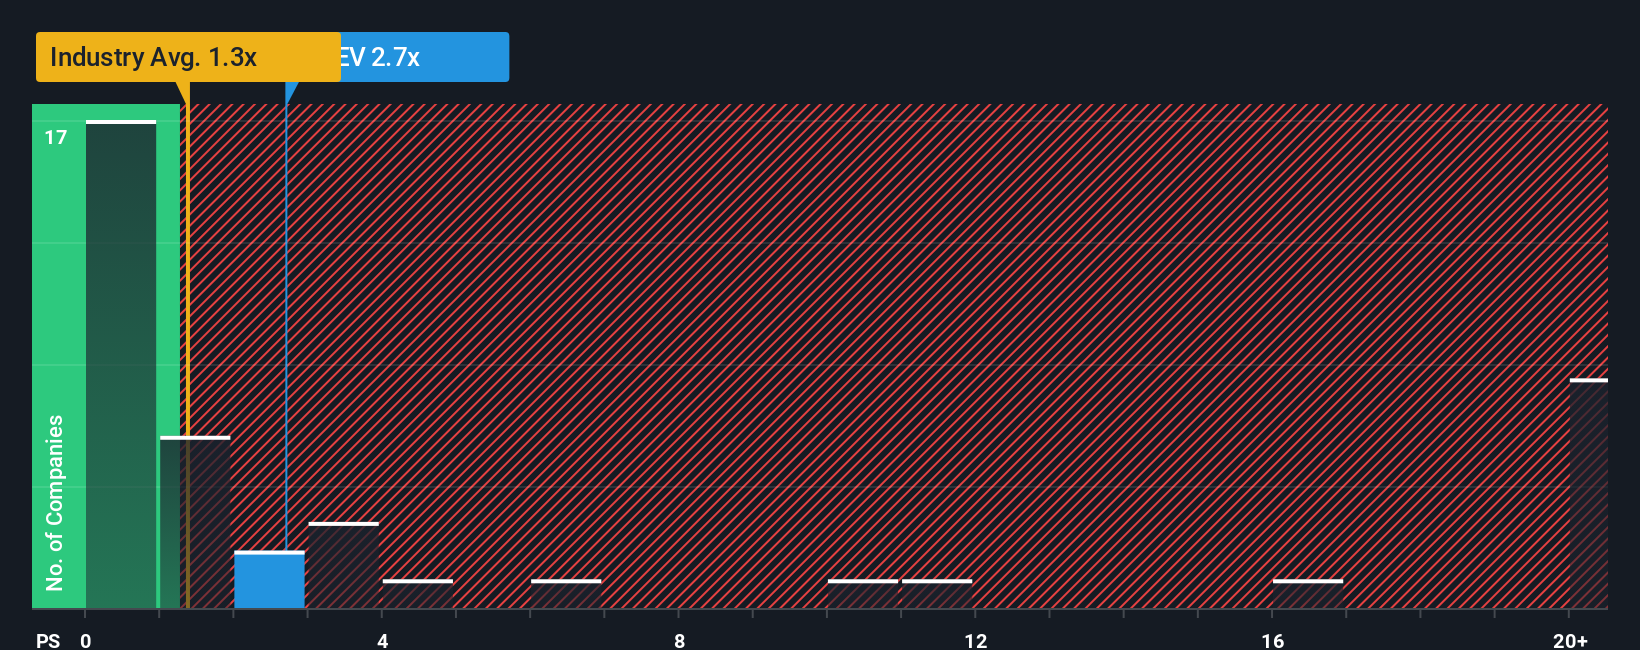
XPeng currently trades on a P/S of 1.94x. That sits above the Auto industry average P/S of 0.64x and below the peer group average of 2.35x. Simply Wall St’s Fair Ratio for XPeng is 1.56x, which is its proprietary estimate of what the P/S could be given XPeng’s earnings growth profile, industry, profit margins, market cap and risk factors.
The Fair Ratio can be more informative than a simple comparison with peers or the industry, because it adjusts for XPeng’s specific mix of growth, risks, profitability, sector and size rather than assuming one multiple fits all.
With the current P/S of 1.94x versus a Fair Ratio of 1.56x, XPeng screens as overvalued on this basis.
Result: OVERVALUED
P/S ratios tell one story, but what if the real opportunity lies elsewhere? Discover 1445 companies where insiders are betting big on explosive growth.
Earlier we mentioned that there is an even better way to understand valuation, so let us introduce you to Narratives, where you spell out your story for XPeng, link that story to your own revenue, earnings and margin assumptions, and see the fair value that drops out, all in one place on Simply Wall St's Community page that millions of investors use.
A Narrative is simply your view of what XPeng is and where it could go, written out in plain language and then tied directly to numbers such as future CN¥ revenue, profit margins and a fair value per share, so the story and the spreadsheet stay in sync.
Because Narratives constantly compare your estimated fair value with XPeng's current share price, they can help you decide whether the gap between price and value is wide enough for you to consider buying or selling, and they automatically refresh when new earnings, news or updates to analyst expectations come through.
For example, one XPeng Narrative on Simply Wall St currently anchors on a fair value estimate of about US$28.24 per share with revenue growth assumptions of 25.02%, a 5.30% profit margin, a 36.39x future P/E and an 11.52% discount rate. A more cautious view on the same Community page uses a lower price target of US$18.27, so you can see how different investors, looking at the same company, can reach very different conclusions about value.
Do you think there's more to the story for XPeng? Head over to our Community to see what others are saying!
This article by Simply Wall St is general in nature. We provide commentary based on historical data and analyst forecasts only using an unbiased methodology and our articles are not intended to be financial advice. It does not constitute a recommendation to buy or sell any stock, and does not take account of your objectives, or your financial situation. We aim to bring you long-term focused analysis driven by fundamental data. Note that our analysis may not factor in the latest price-sensitive company announcements or qualitative material. Simply Wall St has no position in any stocks mentioned.
