Ladder Capital (LADR) Net Margin Compression Tests Bullish Growth Narratives
Ladder Capital Corp. Class A LADR | 9.71 9.71 | -0.72% 0.00% Post |
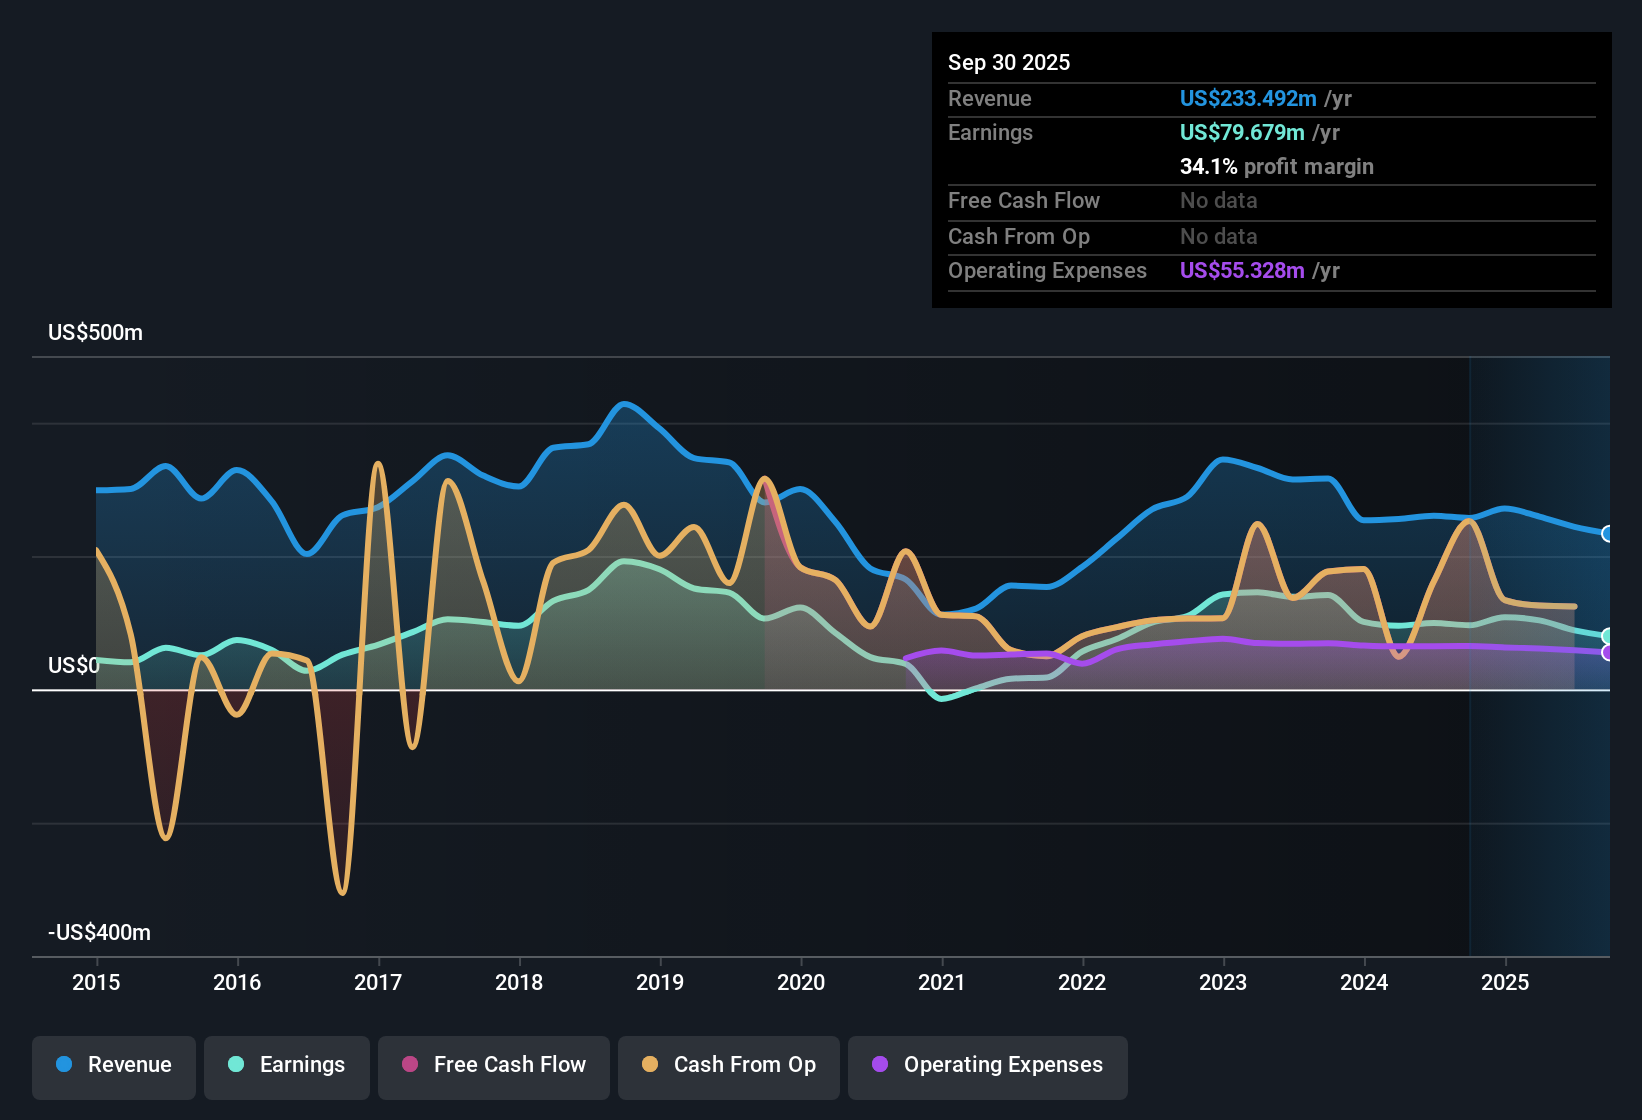
Ladder Capital (LADR) has wrapped up FY 2025 with fourth quarter total revenue of US$50.5 million and basic EPS of US$0.13, capping a year in which quarterly revenue ranged from US$51.0 million to US$57.6 million and EPS moved between US$0.09 and US$0.15. Over the past six reported quarters, total revenue has stayed in a band of roughly US$50 million to US$68.6 million while basic EPS has moved between US$0.09 and US$0.25, giving investors a clear view of how earnings have tracked alongside a relatively consistent top line. With trailing net margin at 29.8% and analysts focused on forecast growth, the latest print supports a close look at the sustainability of these results.
See our full analysis for Ladder Capital.With the headline numbers on the table, the next step is to see how this earnings profile lines up against the widely followed narratives around Ladder Capital’s growth prospects and risk profile.
29.8% net margin against higher FY 2024 levels
- Ladder Capital’s trailing net margin sits at 29.8%, compared with 39.9% a year earlier, alongside FY 2025 full year net income of US$64.2 million on US$215.4 million of revenue.
- Critics highlight that a lower net margin can pressure income oriented investors, and the numbers give that some weight:
- Over the last twelve months, net income of US$64.2 million on US$215.4 million of revenue is a smaller share of sales than the prior 39.9% margin level.
- That margin profile sits next to a dividend yield of 8.96% that is described as not well covered by earnings or free cash flow, so bears point to less room for error.
Premium 20.4x P/E with 21.7% upside targets
- The shares trade on a trailing P/E of 20.4x versus a peer average of 11.7x and industry average of 12.1x, while analysts’ targets point to about 21.7% upside from the current US$10.27 share price to US$12.50.
- What stands out for the bullish view is how growth forecasts are used to justify that premium multiple:
- Earnings are forecast to grow around 21.9% per year and revenue about 13% per year, which bulls argue helps explain why the stock trades above peer and sector P/E levels.
- At the same time, the roughly 21.7% gap between US$10.27 and the US$12.50 price target is framed as potential upside if those growth forecasts play out as expected.
TTM EPS at US$0.51 against dividend and debt coverage concerns
- On a trailing twelve month basis, basic EPS is US$0.51 and net income is US$64.2 million, alongside comments that the dividend payout is not well covered by earnings or free cash flow and that debt is not well covered by operating cash flow.
- Bears argue that this combination puts real pressure on income sustainability, and the reported figures line up with parts of that concern:
- With US$64.2 million of net income against an 8.96% dividend yield, a large share of earnings is likely committed to distributions, which heightens attention on coverage tests.
- Analysis flagging that both the dividend and debt are not well covered by cash flow suggests the balance sheet and payout policies are key areas for investors to keep tracking alongside EPS.
Next Steps
Don't just look at this quarter; the real story is in the long-term trend. We've done an in-depth analysis on Ladder Capital's growth and its valuation to see if today's price is a bargain. Add the company to your watchlist or portfolio now so you don't miss the next big move.
See What Else Is Out There
Ladder Capital pairs a higher P/E multiple with a lower net margin than last year and has flagged concerns around dividend and debt coverage from current earnings.
If rich valuations and those balance sheet red flags are making you cautious, shift your focus to companies in our solid balance sheet and fundamentals stocks screener (45 results) that aim for stronger cash flow support and resilience.
This article by Simply Wall St is general in nature. We provide commentary based on historical data and analyst forecasts only using an unbiased methodology and our articles are not intended to be financial advice. It does not constitute a recommendation to buy or sell any stock, and does not take account of your objectives, or your financial situation. We aim to bring you long-term focused analysis driven by fundamental data. Note that our analysis may not factor in the latest price-sensitive company announcements or qualitative material. Simply Wall St has no position in any stocks mentioned.