Marcus & Millichap (MMI) has put fresh numbers on the board for FY 2025 Q3, with revenue of US$193.9 million and basic EPS of roughly US$0.01, alongside net income excluding extra items of US$0.24 million. The company has seen revenue move from US$168.5 million and basic EPS of roughly US$0.14 loss in Q3 2024 to US$193.9 million and a small positive EPS in Q3 2025. Trailing twelve month figures point to revenue of US$751.3 million and a net loss of US$6.7 million. For investors, the story this quarter is about thin margins and whether improving quarterly EPS can eventually offset the still loss making profile on a trailing basis.
See our full analysis for Marcus & Millichap.
With the latest earnings laid out, the next step is to set these results against the widely followed narratives around growth, profitability, and risk to see which views hold up and which might need a rethink.
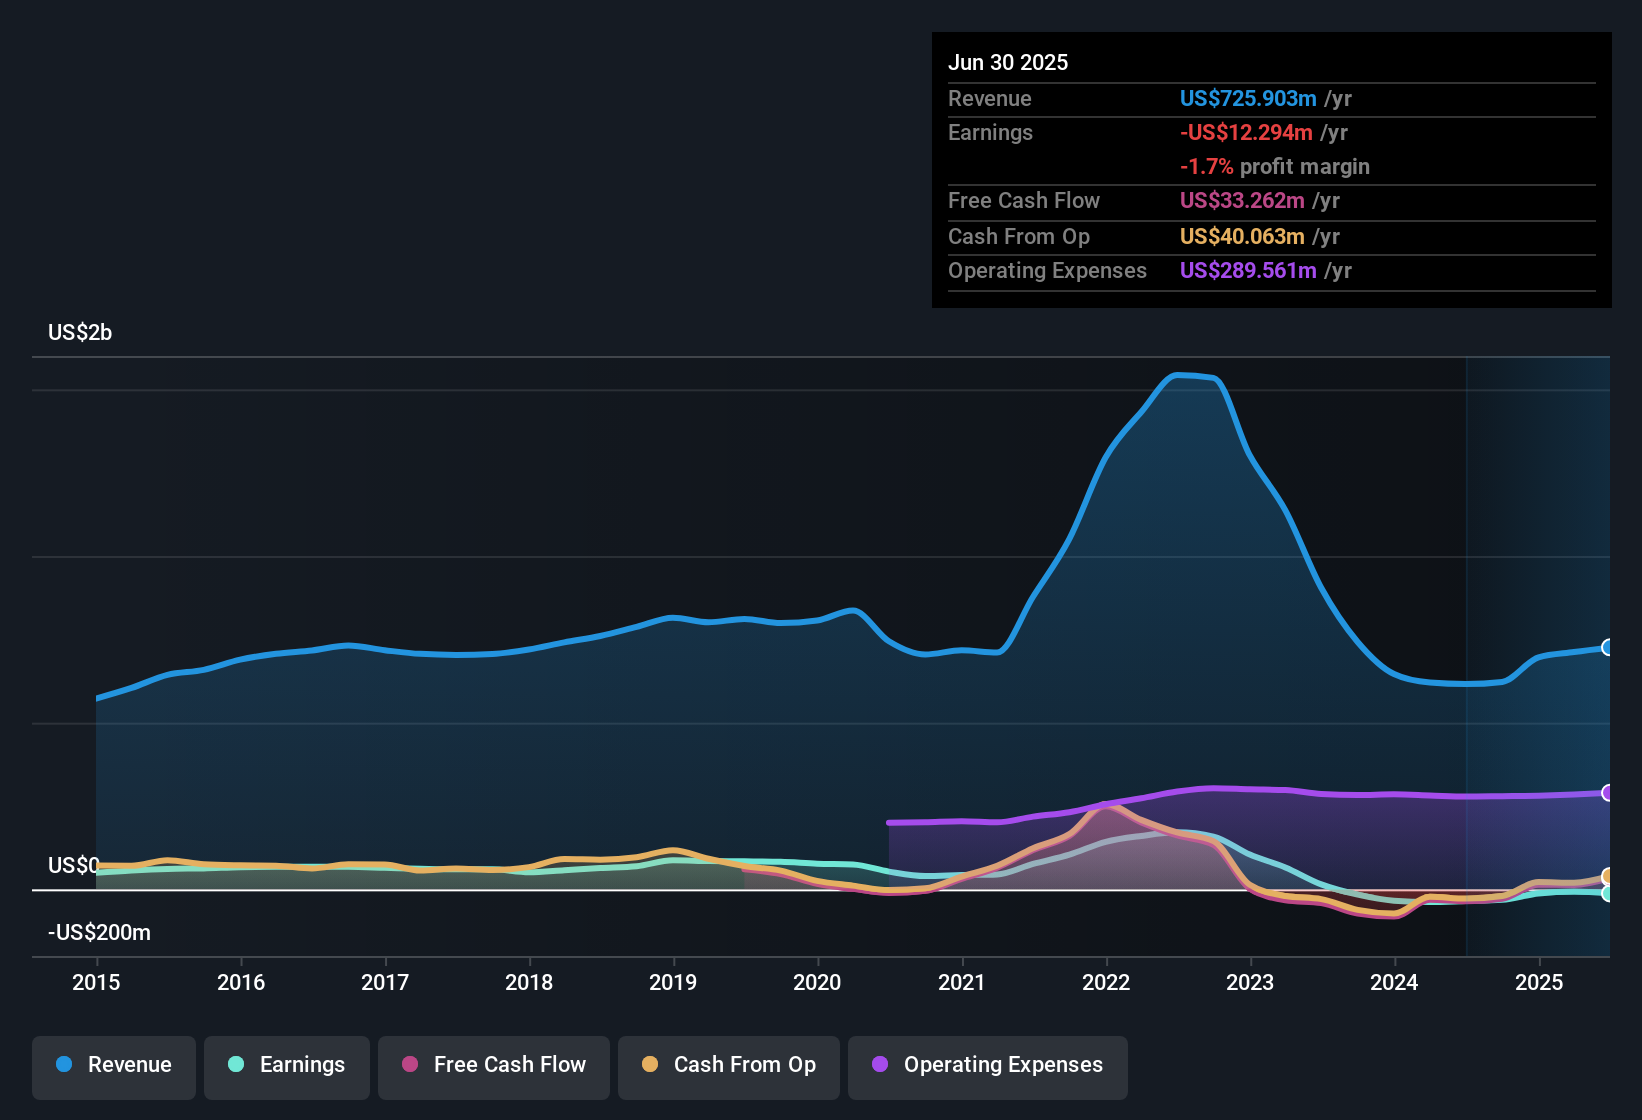
NYSE:MMI Earnings & Revenue History as at Feb 2026
Revenue Growth, Profit Still Thin
On a trailing basis, revenue sits at US$751.3 million with an estimated 14.2% annual growth rate over the last 12 months, while trailing net income excluding extra items is a loss of US$6.7 million.
Consensus narrative points to strong institutional interest and an expanding agent network as growth drivers. However, the trailing loss and thin Q3 profit of US$0.24 million show that higher transaction throughput has not yet translated into sustained earnings, which keeps the profitability part of that story unproven for now.
The consensus view highlights service line diversification and M&A as ways to make revenue more stable. At the same time, the last five years of widening losses at about 52.7% per year underline how hard it has been to keep growth and profitability aligned.
Analysts are using revenue growth assumptions of 17.9% a year and a margin move from roughly a 1.7% loss to a 6.5% profit, which is a much sharper improvement than the current trailing loss profile shows.
Valuation: P/S And DCF Tension
With the share price at US$25.85, the P/S of 1.3x sits above the peer average of 0.3x but below the wider US Real Estate industry at 2.4x, while a DCF fair value of about US$39.96 suggests the shares trade roughly 35% under that estimate.
Bulls argue that strong forecast earnings growth of about 43.01% a year and the DCF fair value together point to upside. Yet the higher P/S versus close peers and the current trailing loss of US$6.7 million mean the market is still paying more per dollar of sales than those peers for a business that is not profitable on a trailing view.
What stands out for the bullish case is that trailing revenue of US$751.3 million is already sizeable. If margins move toward the 6.5% level analysts reference, the current P/S of 1.3x could look more reasonable against that higher earnings base.
At the same time, critics highlight that the P/S premium over peers sits alongside a 1.93% dividend that is not covered by earnings, which supports the more cautious part of the valuation debate even with the DCF fair value at US$39.96.
On numbers like these, bulls see a pricing gap between US$25.85 and the US$39.96 DCF fair value that they want to test against a full upside narrative, while you might be weighing how much the trailing losses matter for your own view.
🐂 Marcus & Millichap Bull Case
Profitability Risks And Dividend Strain
Trailing losses have grown at about 52.7% per year over the past five years and the 1.93% dividend yield is flagged as not well covered by earnings, which sits alongside analysts using an earnings growth forecast of 43.01% a year to justify their forward view.
Bears focus on how heavily the business leans on transaction commissions, with 82% to 84% of revenue from brokerage fees. They argue that this dependence, plus fee pressure and agent retention issues, makes those forecast earnings and dividend sustainability harder to rely on when the trailing numbers still show a loss.
This cautious view lines up with the trailing net loss of US$6.7 million and the pattern of widening losses over five years, which both sit awkwardly next to a dividend that current earnings do not cover.
Critics also point to competitive and technology risks around traditional brokerage models. When combined with commission based revenue and thin Q3 profit of US$0.24 million, these factors reinforce why they pay close attention to the risk section rather than just the revenue growth story.
If you find yourself agreeing with the more cautious read on rising losses and dividend coverage, it can help to walk through the full bear case before you decide how much risk you are comfortable with.
🐻 Marcus & Millichap Bear Case
Next Steps
To see how these results tie into long-term growth, risks, and valuation, check out the full range of community narratives for Marcus & Millichap on Simply Wall St. Add the company to your watchlist or portfolio so you'll be alerted when the story evolves.
See the numbers another way? Take a couple of minutes to test your own thesis against the data and shape a clear view. Do it your way
A great starting point for your Marcus & Millichap research is our analysis highlighting 2 key rewards and 1 important warning sign that could impact your investment decision.
See What Else Is Out There
Marcus & Millichap combines trailing revenue of US$751.3 million with a net loss of US$6.7 million and a dividend that current earnings do not cover, which raises questions about risk and income reliability.
If that mix of widening losses, thin profit and dividend strain feels uncomfortable, shift your focus toward 86 resilient stocks with low risk scores that aim to prioritize more resilient financial profiles right now.
This article by Simply Wall St is general in nature. We provide commentary based on historical data and analyst forecasts only using an unbiased methodology and our articles are not intended to be financial advice. It does not constitute a recommendation to buy or sell any stock, and does not take account of your objectives, or your financial situation. We aim to bring you long-term focused analysis driven by fundamental data. Note that our analysis may not factor in the latest price-sensitive company announcements or qualitative material. Simply Wall St has no position in any stocks mentioned.