
Please use a PC Browser to access Register-Tadawul
Get It
Market Movements Now | Saudi Aramco (2222) Releases Earnings: Q4 Sales Beat Expectations, Profits Lag but Dividend Rises; EIC (1303) reports 100% Profit Growth
SAUDI ARAMCO 2222.SA | 23.90 | -1.73% |
EIC 1303.SA | 11.93 | +1.79% |
NASEEJ 1213.SA | 41.96 | -3.01% |
DAR ALARKAN 4300.SA | 15.08 | -1.57% |
RAOOM 4144.SA | 59.10 | -0.17% |
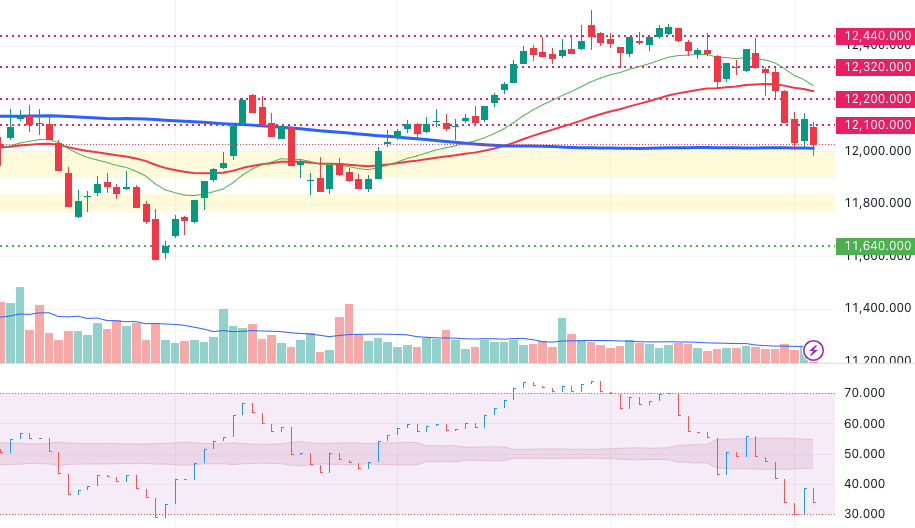
The Tadawul All Shares Index(TASI.SA) formed a Bullish Engulfing Candle pattern near the critical 12100 level yesterday. However, today's session did not see a follow-through action. Instead, the index continued to be pressured by the 12100 key level and is once again testing the 200-day Simple Moving Average (SMA). The combination of the 200-day SMA and the crucial 12000 point level appears to offer significant support. Currently, the index is down approximately 1%. The subsequent behavior of the index warrants close monitoring.
Saudi Aramco Releases Earnings: Q4 Sales Beat Expectations, Profits Lag
Saudi Arabian Oil Co.(2222.SA) reported a 0.97% revenue drop to SAR 1,637.3 billion in 2024 from SAR 1,653.28 billion in 2023, driven by lower crude oil prices and volumes, despite higher refined product sales. Net profit fell 12.39% to SAR 398.42 billion due to reduced revenue and higher costs. The stock declined 2%.
The firm declared a Q4 2024 base dividend of SAR 79.28 billion (SAR 0.3278/share) and a performance-linked dividend of SAR 0.82 billion (SAR 0.0034/share), totaling SAR 80.1 billion (SAR 0.3312/share), payable March 26, 2025, for shareholders as of March 17.
The base dividend saw an increase of 4.2% compared to third quarter of 2024, which is aligned with Saudi Aramco’s dividend policy aiming to deliver a sustainable and progressive dividend.
| Element List | Current Year | Previous Year | %Change |
|---|---|---|---|
| Sales/Revenue | 1,637.3 | 1,653.28 | -0.97 |
| Gross Profit (Loss) | - | - | - |
| Operational Profit (Loss) | 774.63 | 868.29 | -10.79 |
| Net profit (Loss) | 398.42 | 454.76 | -12.39 |
| Total Comprehensive Income | 394.54 | 453.06 | -12.92 |
| Total Shareholders Equity (after Deducting Minority Equity) | 1,458.23 | 1,534.61 | -4.98 |
| Profit (Loss) per Share | 1.63 | 1.87 | |
| All figures are in (Billions) Saudi Arabia, Riyals | |||
FY2024 million SAR | Q3 Earnings | Q4-Market Expectation | Q4 Earnings |
| Sales/Revenue | 464,625.00 | 388,496.50 | 428,587.00 |
| Net Profit (Loss) | 97,621.00 | 88,937.55 | 87,325.00 |
| EPS (Riyal) | 0.40 | 0.37 | 0.36 |
EIC reports 100% Profit Growth
Electrical Industries Co.(1303.SA) (EIC) reported 2024 revenue of SAR 1.99B ($530M), up 27% year-on-year, with net profit nearly doubling to SAR 401.7M ($107M) driven by surging demand for high-voltage substations, infrastructure, and oil/gas projects. Gross profit rose 66% to SAR 665.3M ($177M), supported by higher-margin product diversification. Operational costs increased due to a SAR 26.1M General Authority for Competition penalty and elevated selling/administrative expenses. Shareholders’ equity grew 27% to SAR 946.1M ($252M). Shares fell 1.73% post-announcement. The results reflect robust Saudi industrial expansion but highlight margin pressures from regulatory penalties and operational scaling. All figures relate to the year ended December 31, 2024.
| Element List | Current Year | Previous Year | %Change |
|---|---|---|---|
| Sales/Revenue | 1,987,069 | 1,559,351 | 27.43 |
| Gross Profit (Loss) | 665,315 | 401,295 | 65.79 |
| Operational Profit (Loss) | 455,955 | 264,522 | 72.37 |
| Net profit (Loss) | 401,731 | 201,034 | 99.83 |
| Total Comprehensive Income | 397,429 | 198,343 | 100.37 |
| Total Shareholders Equity (after Deducting Minority Equity) | 946,062 | 744,798 | 27.02 |
| Profit (Loss) per Share | 0.36 | 0.18 | |
| All figures are in (Thousands) Saudi Arabia, Riyals | |||
The top-performing stocks at this point include:
The⚡lightning bolt icon indicates that the stock's trading volume so far today has already exceeded its average trading volume over the past three months.
The ⭐️ star icon indicates that the stock reached a new 52-week high today.
| Stock | Price | % Change | Significant Volume Surge vs. 3M Average |
|---|---|---|---|
| Naseej International Trading Co.(1213.SA) | 100.20 | +2.45% | - |
| Dar Alarkan Real Estate Development Co.(4300.SA) ⭐️ | 18.60 | +2.20% | - |
| Raoom Trading Co.(4144.SA) | 176.00 | +1.62% | - |
| Advanced Petrochemical Co.(2330.SA) | 26.40 | +1.54% | - |
| Al Hassan Ghazi Ibrahim Shaker Co.(1214.SA) | 30.15 | +1.17% | - |
| Stock | Price | % Change | Significant Volume Surge vs. 3M Average |
|---|---|---|---|
| Nice One Beauty Digital Marketing Co.(4193.SA) | 53.40 | -9.95% | - |
| Al-Etihad Cooperative Insurance Co.(8170.SA)⚡ | 15.76 | -7.84% | 10.50% |
| Fawaz Abdulaziz Alhokair Co.(4240.SA) | 12.80 | -4.76% | - |
| Leejam Sports Co.(1830.SA) | 147.00 | -4.05% | - |
| East Pipes Integrated Company for Industry(1321.SA) | 145.40 | -3.96% | - |
| Al Rajhi Bank(1120.SA) ⭐️ | 101.20 | -0.78% | - |
- Reporting by Zaid, Sahm News team
