Moelis (MC) TTM Margin Improvement To 15.4% Tests Bearish Profitability Narratives
Moelis & Co. Class A MC | 0.00 |
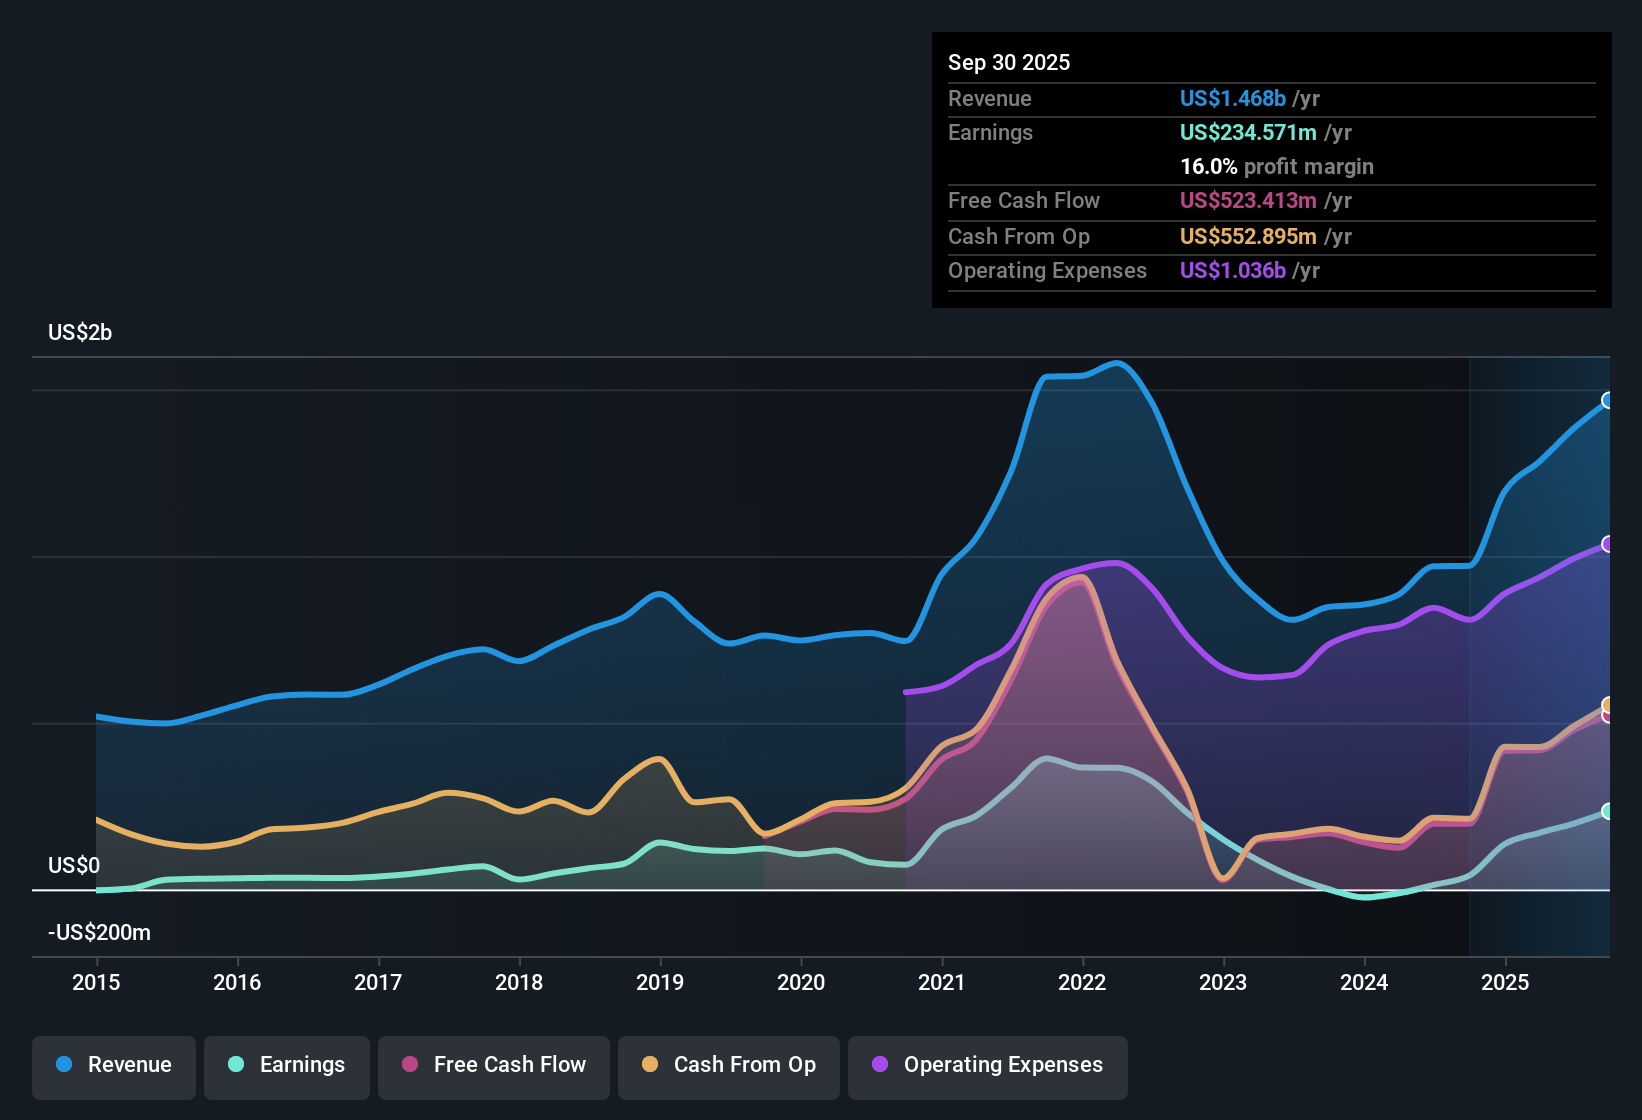
Moelis (MC) has rounded out FY 2025 with fourth quarter revenue of US$487.9 million and basic EPS of US$1.19, setting the tone for a year in which trailing 12 month revenue reached about US$1.5 billion and EPS came in at US$3.11. The company reported an increase in revenue from US$438.7 million and EPS of US$1.27 in Q4 2024 to US$487.9 million and EPS of US$1.19 in Q4 2025, while trailing 12 month EPS moved from US$1.93 to US$3.11 over the same period. This provides investors with a snapshot of how the top and bottom line have been tracking into the latest results as margins strengthened over the year.
See our full analysis for Moelis.With the headline figures on the table, the next step is to see how these results align with the key bullish and bearish narratives that have been shaping market expectations around Moelis.
TTM net margin rises to 15.4%
- Over the last 12 months, Moelis earned US$233.0 million of net income on US$1.5b of revenue, which works out to a 15.4% net margin compared with 11.4% a year earlier.
- For those taking a bullish view, one point that stands out is that trailing 12 month earnings grew 71.3% over the year, while revenue over that same period was US$1.5b. The higher 15.4% margin supports the idea that the business recently converted a larger share of its fee pool into profit, even though the five year earnings trend shows a 20.9% per year decline that longer term bulls need to factor in.
Revenue base reaches about US$1.5b
- The trailing 12 month revenue line reached about US$1.5b by Q4 2025, compared with US$1.2b a year earlier, giving a sense of the fee pool that supported the US$3.11 of trailing EPS.
- Supporters of a more optimistic view point out that earnings are forecast to grow about 24.9% per year and revenue about 13.7% per year. The combination of a US$1.5b revenue base and 15.4% net margin is used to argue that recent profitability levels could underpin those growth expectations, even though the five year earnings record, with a 20.9% per year decline, keeps that bullish case grounded in mixed history.
Mixed valuation signals around 22.8x P/E
- At a share price of US$71.68, Moelis is described as trading on a 22.8x P/E, in line with the US Capital Markets industry average of 22.8x but above the 9.7x peer average. A DCF fair value of about US$101.51 suggests the price is roughly 29.4% below that estimate.
- Critics focus on the higher 22.8x P/E relative to the 9.7x peer average and the comment that the dividend record is unstable, and set that against the higher 15.4% trailing net margin and 71.3% earnings gain over the year. From this perspective, the bearish angle leans on peer-relative valuation and income reliability, even as the DCF fair value of US$101.51 and current price of US$71.68 leave room for investors who put more weight on cash flow based valuation to see a different risk reward balance.
Want a clear view of how these earnings, margins, and valuation signals fit into the bigger story for Moelis? 📊 Read the full Moelis Consensus Narrative.
Next Steps
Don't just look at this quarter; the real story is in the long-term trend. We've done an in-depth analysis on Moelis's growth and its valuation to see if today's price is a bargain. Add the company to your watchlist or portfolio now so you don't miss the next big move.
See What Else Is Out There
Moelis pairs a higher 22.8x P/E with a five year earnings record that declined 20.9% per year, which can make some investors cautious about paying up.
If you are questioning whether that track record justifies the current multiple, take a moment to scan our 55 high quality undervalued stocks that highlight companies where valuations and fundamentals line up more comfortably.
This article by Simply Wall St is general in nature. We provide commentary based on historical data and analyst forecasts only using an unbiased methodology and our articles are not intended to be financial advice. It does not constitute a recommendation to buy or sell any stock, and does not take account of your objectives, or your financial situation. We aim to bring you long-term focused analysis driven by fundamental data. Note that our analysis may not factor in the latest price-sensitive company announcements or qualitative material. Simply Wall St has no position in any stocks mentioned.