Murphy USA (MUSA) has wrapped up FY 2025 with fourth quarter revenue of US$4.7b and basic EPS of US$7.61, on net income of US$141.9m, setting the tone for how investors will read the full year. Over recent periods, the company has seen quarterly revenue move from US$4.1b in Q4 2024 to US$4.7b in Q4 2025, while basic EPS shifted from US$7.07 to US$7.61 over the same span. Trailing twelve month EPS stands at US$24.38 on net income of US$470.6m, leaving investors focused squarely on how the 2.4% net margin and modest reward profile shape the quality of these results.
See our full analysis for Murphy USA.
With the headline numbers on the table, the next step is to weigh them against the dominant stories around Murphy USA, testing where the latest earnings back up the prevailing narratives and where they start to push against them.
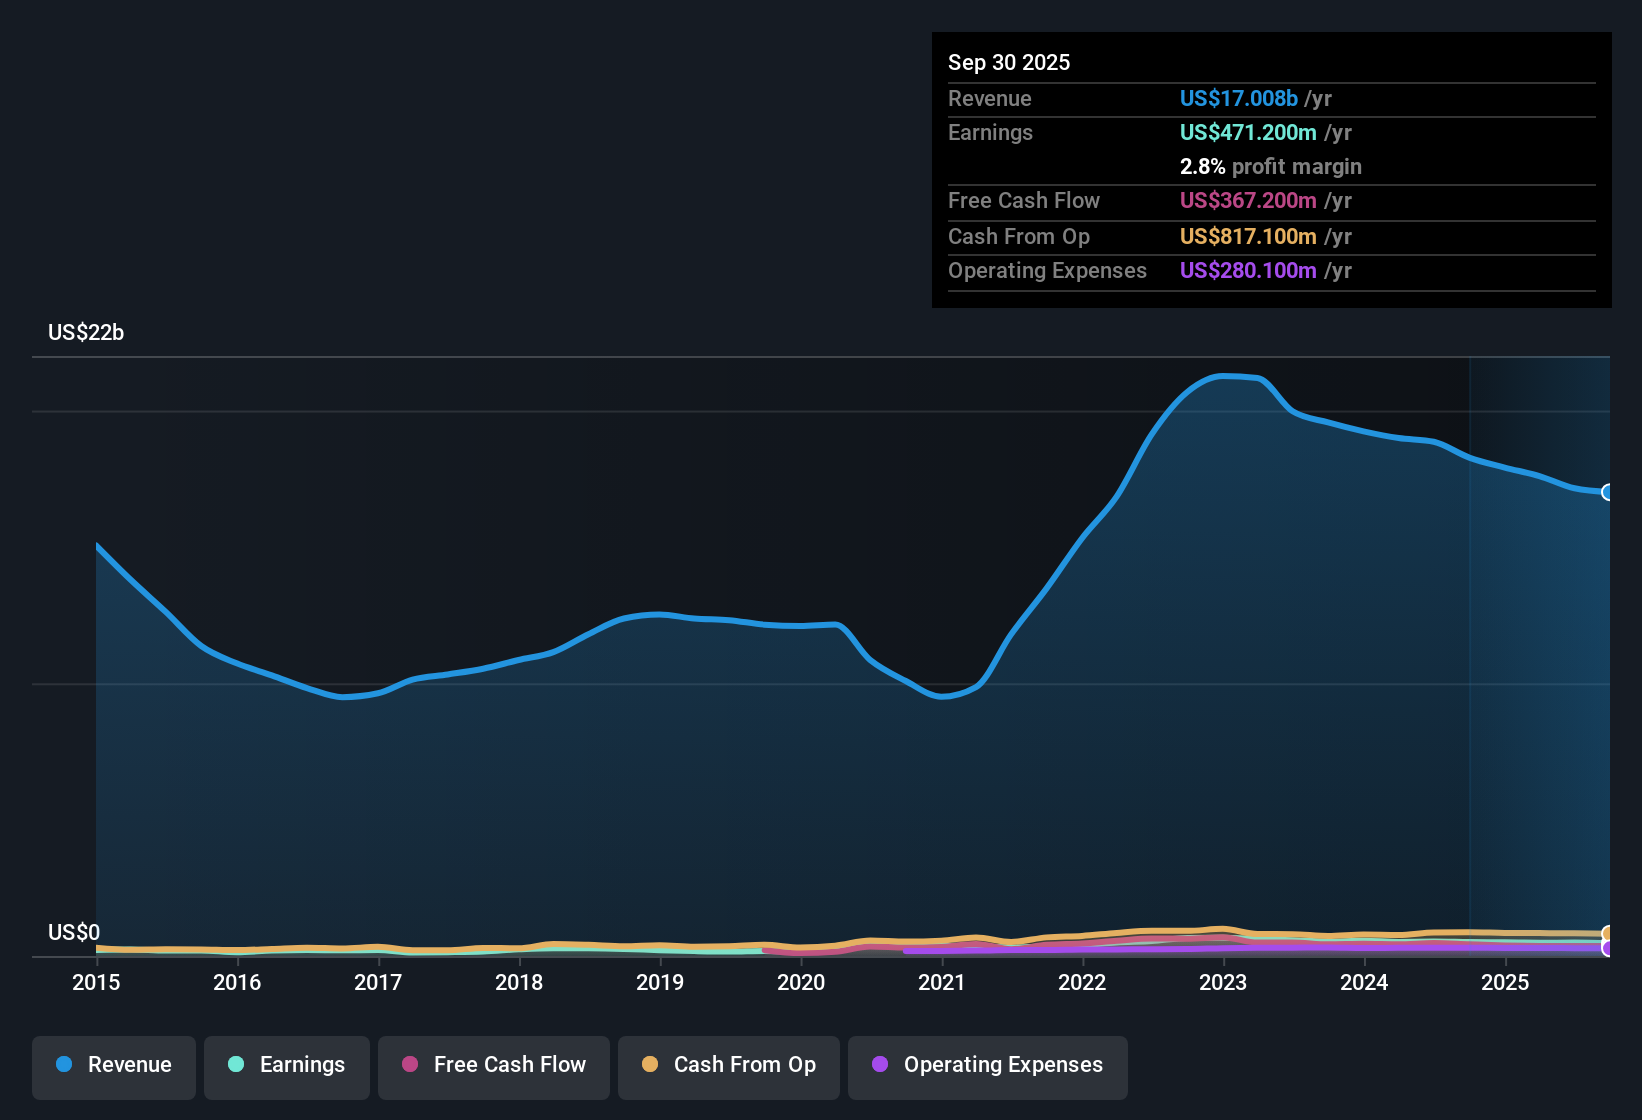
NYSE:MUSA Earnings & Revenue History as at Feb 2026
2.4% Net Margin Puts Profitability In Focus
Over the last 12 months, Murphy USA earned US$470.6 million in net income on US$19.4b of revenue, which works out to a 2.4% net margin compared with 2.8% a year earlier.
What stands out for a bullish story built around steady cash generation is that five year earnings growth of about 4.4% a year now sits beside a trailing year where earnings drifted lower, so investors have to weigh the longer history against the more recent squeeze in margins.
Supporters pointing to that 4.4% annual earnings growth and forecast 5.4% yearly earnings expansion are working with a picture of modest, ongoing progress even as the latest 2.4% margin is below last year.
At the same time, the margin step down from 2.8% to 2.4% means the recent year does not fully match the smoother trend implied by those multi year averages, which can make the bullish case look more cautious around profitability.
With margins under a bit more pressure than in the recent past, many investors will want to see how the longer term growth story and the latest profit squeeze are being weighed against each other in more detailed narratives before making up their mind. 📊 Read the full Murphy USA Consensus Narrative.
Revenue Near US$19.4b, Growth Forecast Around 3.9%
Trailing twelve month revenue sits at US$19.4b, and revenue growth is forecast at roughly 3.9% per year alongside expected earnings growth of about 5.4% a year.
Supporters of a more bullish angle often highlight the combination of this large revenue base and those mid single digit growth forecasts, and the current numbers partly fit that story but also show where it is being tested.
The pattern of quarterly revenue in FY 2025, from US$4.0b in Q1 to US$4.7b in Q4, lines up with the idea of a business that can keep volumes and sales moving, which fits a bullish view that modest growth can add up over time.
However, the trailing net income of US$470.6 million versus US$502.5 million a year earlier shows that, even with a revenue base around US$19.4b, earnings have not moved in lockstep with those sales, which can complicate any straightforward bullish growth story.
P/E Premium And 3.2% DCF Gap
The shares trade on a P/E of about 15.7x versus a peer average of 11.4x and a US Specialty Retail average of 22.3x, while the DCF fair value of roughly US$410.48 sits about 3.2% above the current share price of US$397.42.
Critics who take a more cautious stance often point to that premium to peers and the high debt level, and the current figures give them some support while also setting limits on how stretched things look.
The 15.7x P/E compared with 11.4x for the peer group suggests the market is paying more for Murphy USA’s earnings than for closer comparables, which fits a bearish concern about a relative premium.
On the other hand, the shares sitting only about 3.2% below the DCF fair value and below the broader industry P/E of 22.3x means the valuation picture is not extreme, so the cautious narrative has to lean more on factors like the high level of debt and the weaker 2.4% margin than on clear signs of overpricing.
Next Steps
Don't just look at this quarter; the real story is in the long-term trend. We've done an in-depth analysis on Murphy USA's growth and its valuation to see if today's price is a bargain. Add the company to your watchlist or portfolio now so you don't miss the next big move.
See What Else Is Out There
A 2.4% net margin, earnings that sit below last year, a premium P/E to peers, and high debt all put resilience and downside risk in the spotlight.
If that mix makes you cautious about shocks, take a few minutes to scan 81 resilient stocks with low risk scores so you can quickly focus on companies with more defensive profiles.
This article by Simply Wall St is general in nature. We provide commentary based on historical data and analyst forecasts only using an unbiased methodology and our articles are not intended to be financial advice. It does not constitute a recommendation to buy or sell any stock, and does not take account of your objectives, or your financial situation. We aim to bring you long-term focused analysis driven by fundamental data. Note that our analysis may not factor in the latest price-sensitive company announcements or qualitative material. Simply Wall St has no position in any stocks mentioned.