
Please use a PC Browser to access Register-Tadawul
Get It
Northrim BanCorp Full Year 2024 Earnings: Beats Expectations
Northrim BanCorp, Inc. NRIM | 27.64 | +1.32% |
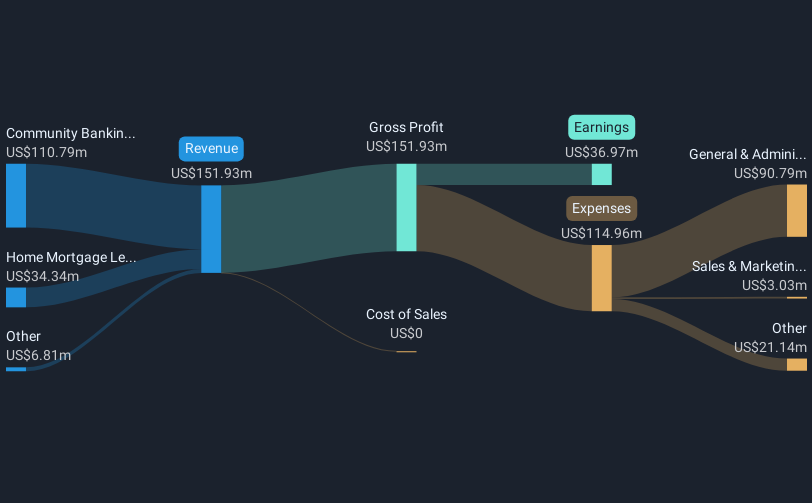
All figures shown in the chart above are for the trailing 12 month (TTM) period
Revenue exceeded analyst estimates by 1.1%. Earnings per share (EPS) also surpassed analyst estimates by 4.8%.
The primary driver behind last 12 months revenue was the Community Banking segment contributing a total revenue of US$110.8m (73% of total revenue). The largest operating expense was General & Administrative costs, amounting to US$90.8m (79% of total expenses). Explore how NRIM's revenue and expenses shape its earnings.
Looking ahead, revenue is forecast to grow 13% p.a. on average during the next 2 years, compared to a 7.3% growth forecast for the Banks industry in the US.
The company's shares are down 9.1% from a week ago.
Just as investors must consider earnings, it is also important to take into account the strength of a company's balance sheet. We have a graphic representation of Northrim BanCorp's balance sheet and an in-depth analysis of the company's financial position.
This article by Simply Wall St is general in nature. We provide commentary based on historical data and analyst forecasts only using an unbiased methodology and our articles are not intended to be financial advice. It does not constitute a recommendation to buy or sell any stock, and does not take account of your objectives, or your financial situation. We aim to bring you long-term focused analysis driven by fundamental data. Note that our analysis may not factor in the latest price-sensitive company announcements or qualitative material. Simply Wall St has no position in any stocks mentioned.
