Oak Valley Bancorp (OVLY) Margin Easing Challenges Steady Compounder Narrative In FY 2025 Results

Oak Valley Bancorp +1.24%

Oak Valley Bancorp

OVLY

32.71

+1.24%

Oak Valley Bancorp FY 2025 earnings snapshot

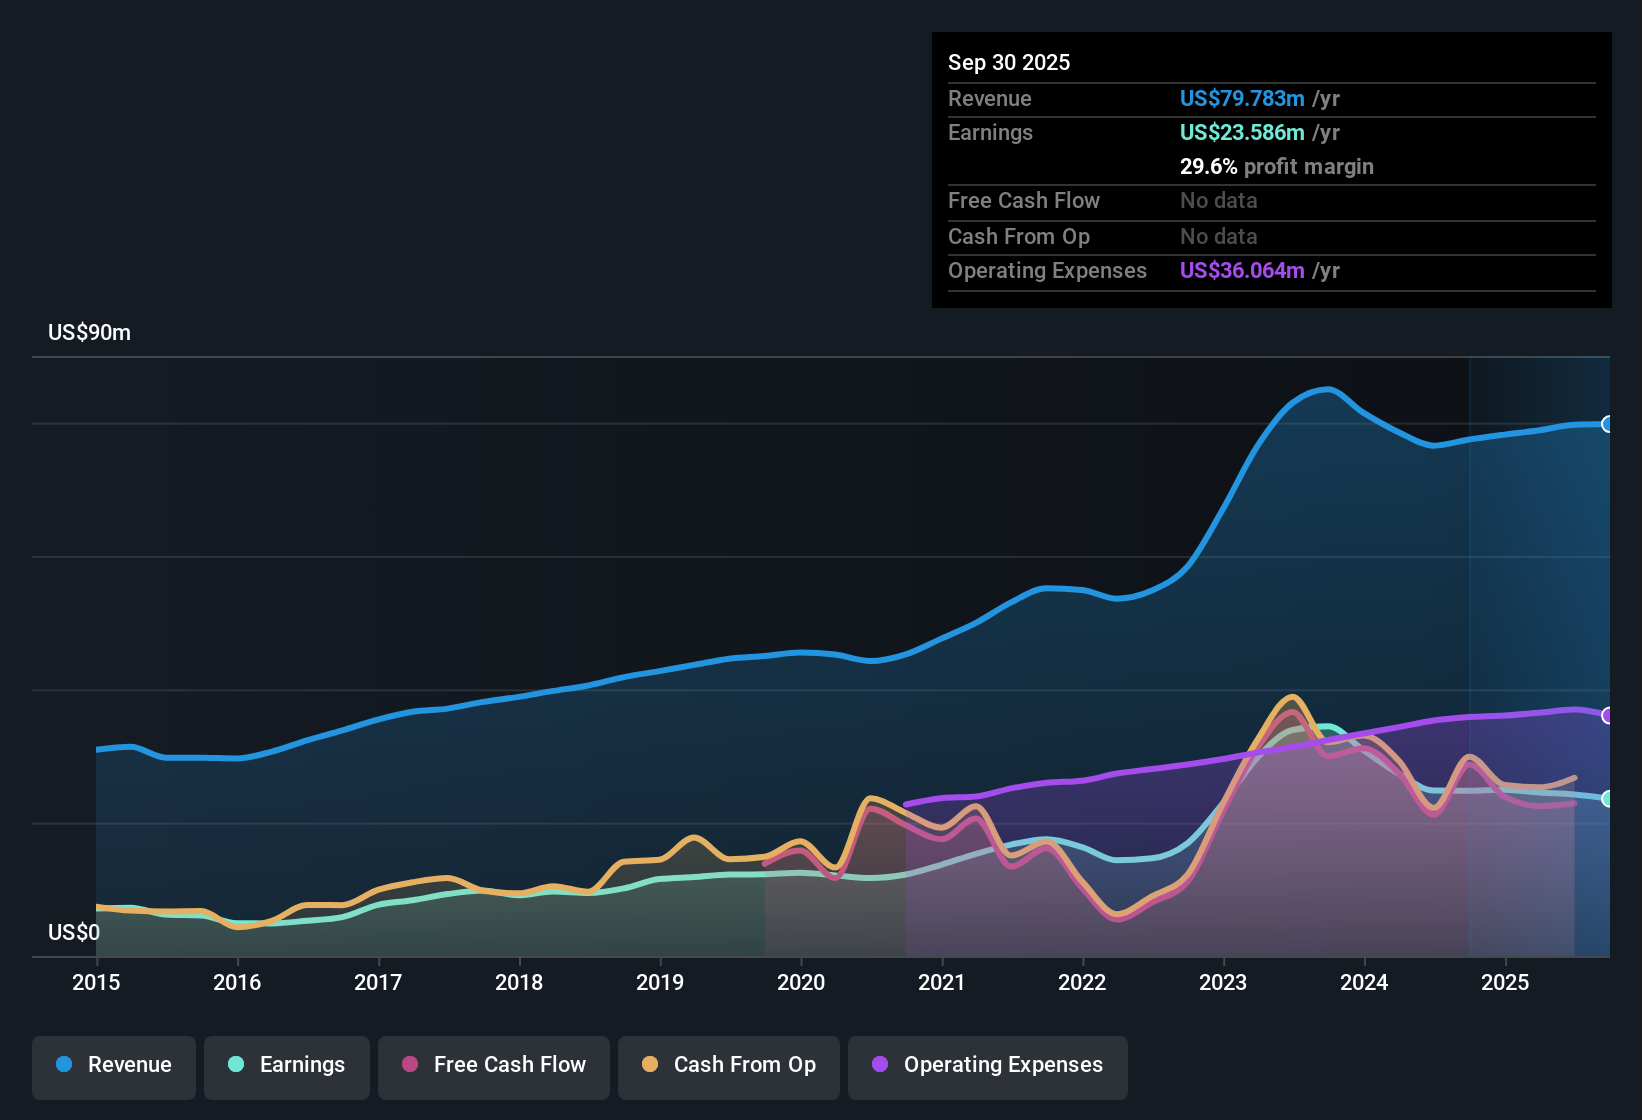
Oak Valley Bancorp (OVLY) has wrapped up FY 2025 with fourth quarter total revenue of about US$20.4 million and basic EPS of roughly US$0.77, setting the tone for how the full year’s numbers land for shareholders. The company has seen quarterly revenue move between US$19.3 million and US$21.2 million over the past six reported periods, while basic EPS has ranged from about US$0.64 to US$0.89, giving investors a clearer view of how the income line has tracked alongside top line stability. With a trailing net margin of 29.5% and a dividend yield of 1.87%, investors may now focus on how those margins compare with the latest set of results.

See our full analysis for Oak Valley Bancorp.

With the earnings picture on the table, the next step is to see how these results line up with the prevailing narratives around Oak Valley Bancorp, highlighting where the numbers support the story and where they push back against it.

NasdaqCM:OVLY Earnings & Revenue History as at Jan 2026

Net margin eases to 29.5%

  • Over the last 12 months, Oak Valley Bancorp reported a net profit margin of 29.5%, compared with 31.9% in the prior year, alongside trailing 12 month revenue of US$80.9 million and net income of US$23.9 million.
  • A key point is how this softer margin sits alongside a generally positive longer term earnings picture. Earlier data describes 11.1% annualized earnings growth over five years, even though the most recent one year period showed weaker earnings. As a result, investors are weighing a bullish story about steady profitability against the fact that recent trailing performance has not been as strong as that longer term trend.

Earnings trend versus 2.9 TTM EPS

  • On a trailing 12 month basis, basic EPS is US$2.90, compared with quarterly EPS ranging from about US$0.64 to US$0.89 over the last six reported quarters. This indicates that the latest year’s per share profit is built from fairly consistent quarterly contributions.
  • Bulls often point to community banks as steady compounders, and in this case that idea is partly supported by the five year annualized earnings growth rate of 11.1%. However, the most recent year is described as having weaker earnings, and EPS has moved from US$3.04 in late 2024 to US$2.90 by the end of 2025. This means the bullish case of uninterrupted compounding has to account for this softer recent patch rather than treating the long term trend as the whole story.
📊 Read the full Oak Valley Bancorp Consensus Narrative.

P/E of 11.1x and DCF fair value gap

  • At a share price of US$32.15, Oak Valley Bancorp trades on a P/E of 11.1x compared with a peer group average of 10.4x and a US Banks industry average of 11.8x. A DCF fair value of US$63.31 suggests the current price is about 49.2% below that model estimate.
  • For a cautious investor, what stands out is that the stock sits slightly above peers on P/E and below the wider industry, while the DCF fair value implies a large upside gap. Bears who focus on softer recent margins and earnings therefore have to weigh those concerns against a valuation framework that points to a wide discount, rather than a stock that appears clearly expensive on these reported numbers.

Next Steps

Don't just look at this quarter; the real story is in the long-term trend. We've done an in-depth analysis on Oak Valley Bancorp's growth and its valuation to see if today's price is a bargain. Add the company to your watchlist or portfolio now so you don't miss the next big move.

Explore Alternatives

Oak Valley Bancorp’s softer recent earnings, easing net margin, and modest dip in EPS from US$3.04 to US$2.90 may leave you wanting steadier growth.

If you prefer companies with more consistent earnings momentum across cycles, check out our stable growth stocks screener (2180 results) to quickly focus on businesses built around steadier performance profiles.

This article by Simply Wall St is general in nature. We provide commentary based on historical data and analyst forecasts only using an unbiased methodology and our articles are not intended to be financial advice. It does not constitute a recommendation to buy or sell any stock, and does not take account of your objectives, or your financial situation. We aim to bring you long-term focused analysis driven by fundamental data. Note that our analysis may not factor in the latest price-sensitive company announcements or qualitative material. Simply Wall St has no position in any stocks mentioned.

Every question you ask will be answered
Scan the QR code to contact us
whatsapp
Also you can contact us via