OSI Systems (OSIS) just posted Q2 2026 results with revenue of US$464.1 million and basic EPS of US$2.31, alongside trailing twelve month revenue of about US$1.8 billion and EPS of US$9.11 that reflect 13.9% earnings growth over the past year. The company has seen quarterly revenue move from US$419.8 million in Q2 2025 to US$464.1 million in Q2 2026, while basic EPS has shifted from US$2.26 to US$2.31 over the same period, set against an improved trailing net margin of 8.5%. For investors, the focus here is on consistent profit generation and margins that have been holding up well as the business scales.
See our full analysis for OSI Systems.
With the latest numbers on the table, the next step is to see how this earnings profile lines up with the prevailing narratives around OSI Systems, and where those stories might need an update.
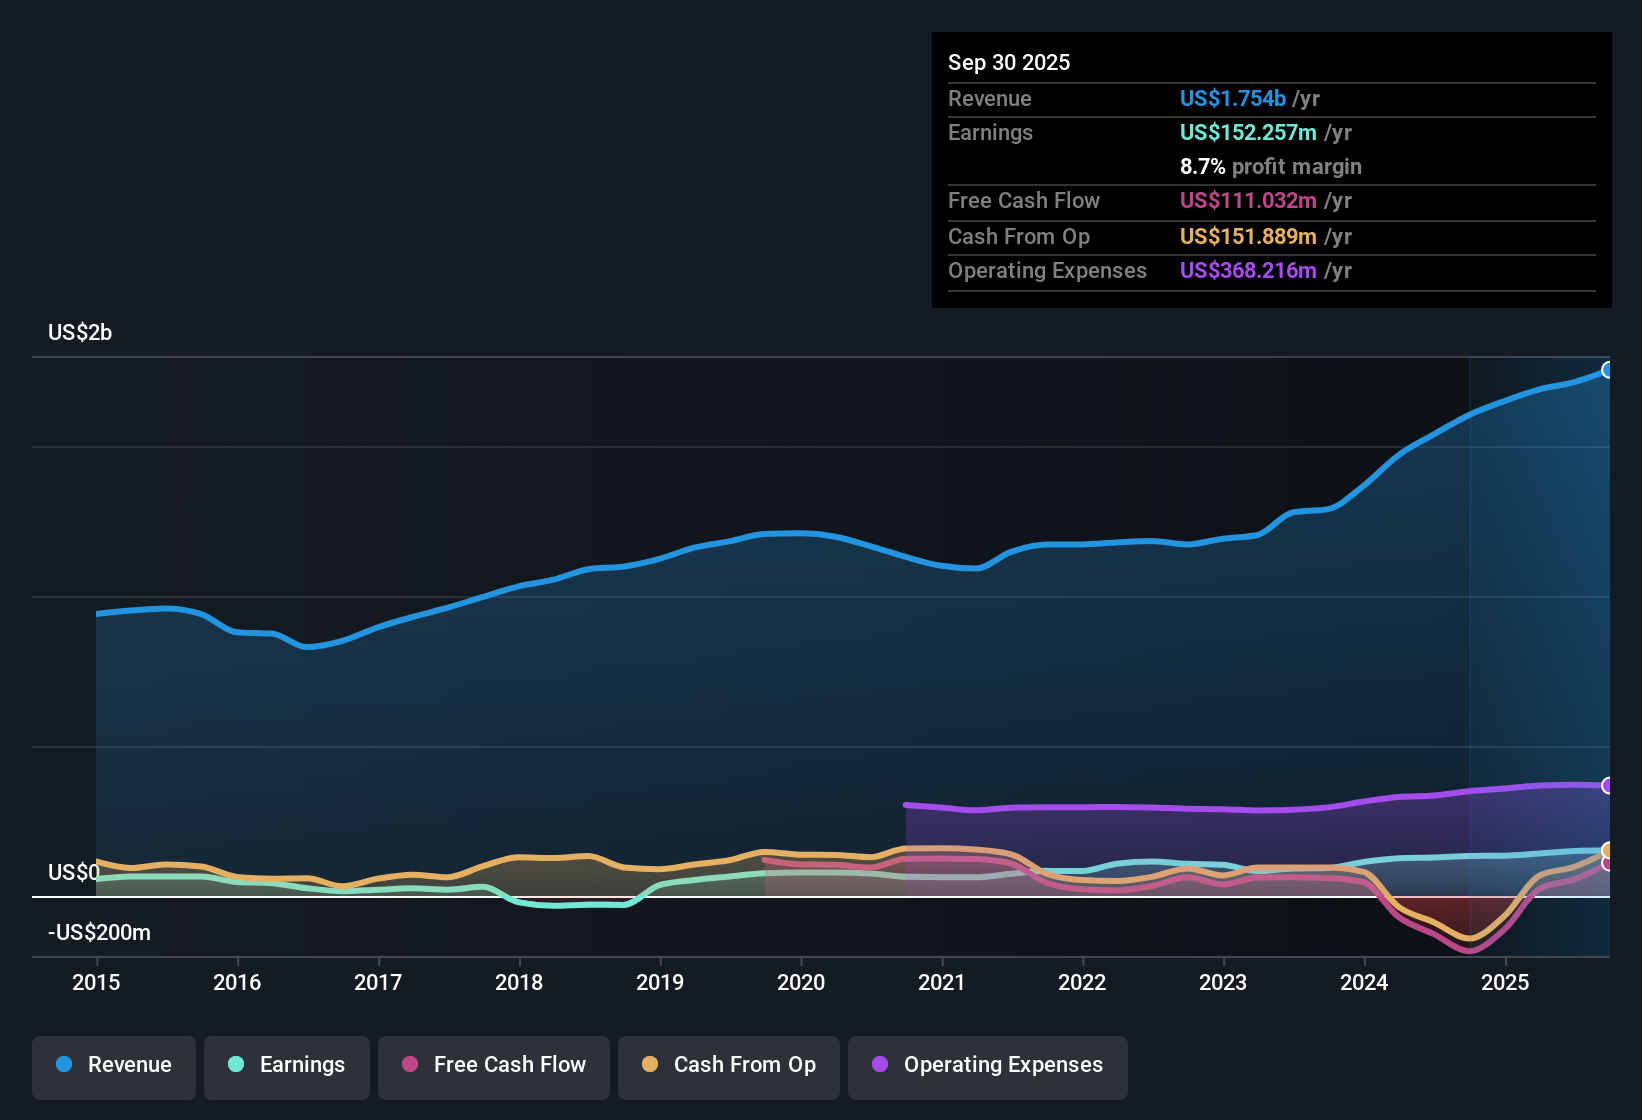
NasdaqGS:OSIS Earnings & Revenue History as at Jan 2026
13.9% earnings growth outpaces 5.6% sales lift
Over the last 12 months, earnings grew 13.9% while revenue growth is quoted at 5.6% per year, so profit expanded faster than sales even though revenue growth is flagged as slower than the broader US market at 10.6% per year.
What stands out for the bullish side is that this pattern shows up across several data points, with trailing twelve month EPS at US$9.11 and net income of US$153.1 million sitting above the quarterly net income run rate. This is occurring even as the revenue growth rate is described as only 5.6% per year, which heavily supports a bullish view that the business is getting more efficient even if top line growth is steadier than some US peers.
For example, quarterly revenue moved between US$344.0 million and US$504.9 million over the last six reported quarters while EPS stayed consistently above US$1.07, suggesting the company has been able to convert varying sales levels into profits on a fairly regular basis.
The improvement in trailing net margin to 8.5% from 8.1%, alongside five year earnings growth that averaged 15.6% per year, backs the argument that profitability has been a key driver of value creation, even with only mid single digit revenue growth cited in the data.
A 13.9% earnings lift on only 5.6% revenue growth is exactly the sort of gap bullish investors pay close attention to when they build a long term story around a company like this.
📊 Read the full OSI Systems Consensus Narrative.
Margins at 8.5% with mixed balance sheet signals
The trailing net margin of 8.5%, compared with 8.1% a year earlier, sits alongside a key risk that operating cash flow did not fully cover debt over the last 12 months, so profitability on paper is being reported at the same time that cash coverage of borrowings is flagged as a weakness.
Critics highlight that this mix of solid profits and weaker cash coverage raises questions about how durable the current margin level is. While the margin data support a bullish read on operations, the debt coverage flag aligns more with a bearish concern that the company may need to dedicate a greater share of future cash flows to servicing obligations instead of reinvesting.
The risk summary explicitly lists debt not being well covered by operating cash flow as a major issue, which counters any simple bullish takeaway from an 8.5% margin and reminds you that earnings and cash can behave differently.
At the same time, the data note that insider selling over the past three months has not been substantial, which slightly weakens a bearish claim that management actions are signaling strong pessimism, even though it does not remove the debt coverage risk itself.
P/E of 27.7x with price above DCF fair value
The shares trade on a P/E of 27.7x, roughly in line with the US electronic industry average of 27.6x and below the referenced peer average of 38.1x, while the current share price of US$250.14 sits above a DCF fair value of US$208.40 that is cited in the risk and reward summary.
What is interesting for a bearish check is how these numbers fit together. On one hand the P/E ratio does not look stretched against industry data, yet the same dataset flags that the stock trades above its DCF fair value. This gives bears concrete valuation fuel even as historical earnings growth of 13.9% and forecast growth of about 13.2% per year provide bulls with an equally numeric argument that the company has been growing into that multiple.
The roughly US$41.74 gap between the share price of US$250.14 and the DCF fair value of US$208.40 is a clear quantified concern for anyone arguing the shares are priced fully or more than fully for current cash flow expectations.
Against that, the fact that earnings growth averaged 15.6% per year over five years and is forecast at about 13.2% per year gives bulls some comfort that a P/E around the industry average is not out of line, highlighting the tug of war between growth data and valuation signals in the current setup. Next Steps
Don't just look at this quarter; the real story is in the long-term trend. We've done an in-depth analysis on OSI Systems's growth and its valuation to see if today's price is a bargain. Add the company to your watchlist or portfolio now so you don't miss the next big move.
See What Else Is Out There
For all the solid earnings figures, the mix of an 8.5% net margin, limited cash coverage of debt and a share price above DCF fair value raises some questions about financial resilience.
If you want companies where debt and liquidity appear to be strengths rather than open questions, check out solid balance sheet and fundamentals stocks screener (391 results) to focus on businesses built on sturdier financial footing right now.
This article by Simply Wall St is general in nature. We provide commentary based on historical data and analyst forecasts only using an unbiased methodology and our articles are not intended to be financial advice. It does not constitute a recommendation to buy or sell any stock, and does not take account of your objectives, or your financial situation. We aim to bring you long-term focused analysis driven by fundamental data. Note that our analysis may not factor in the latest price-sensitive company announcements or qualitative material. Simply Wall St has no position in any stocks mentioned.