PCB Bancorp (PCB) Net Profit Margin Surges, Reinforcing Bullish Value Investor Narrative

PACIFIC CITY FINANCIAL CORP +0.26%

PACIFIC CITY FINANCIAL CORP

PCB

23.26

+0.26%

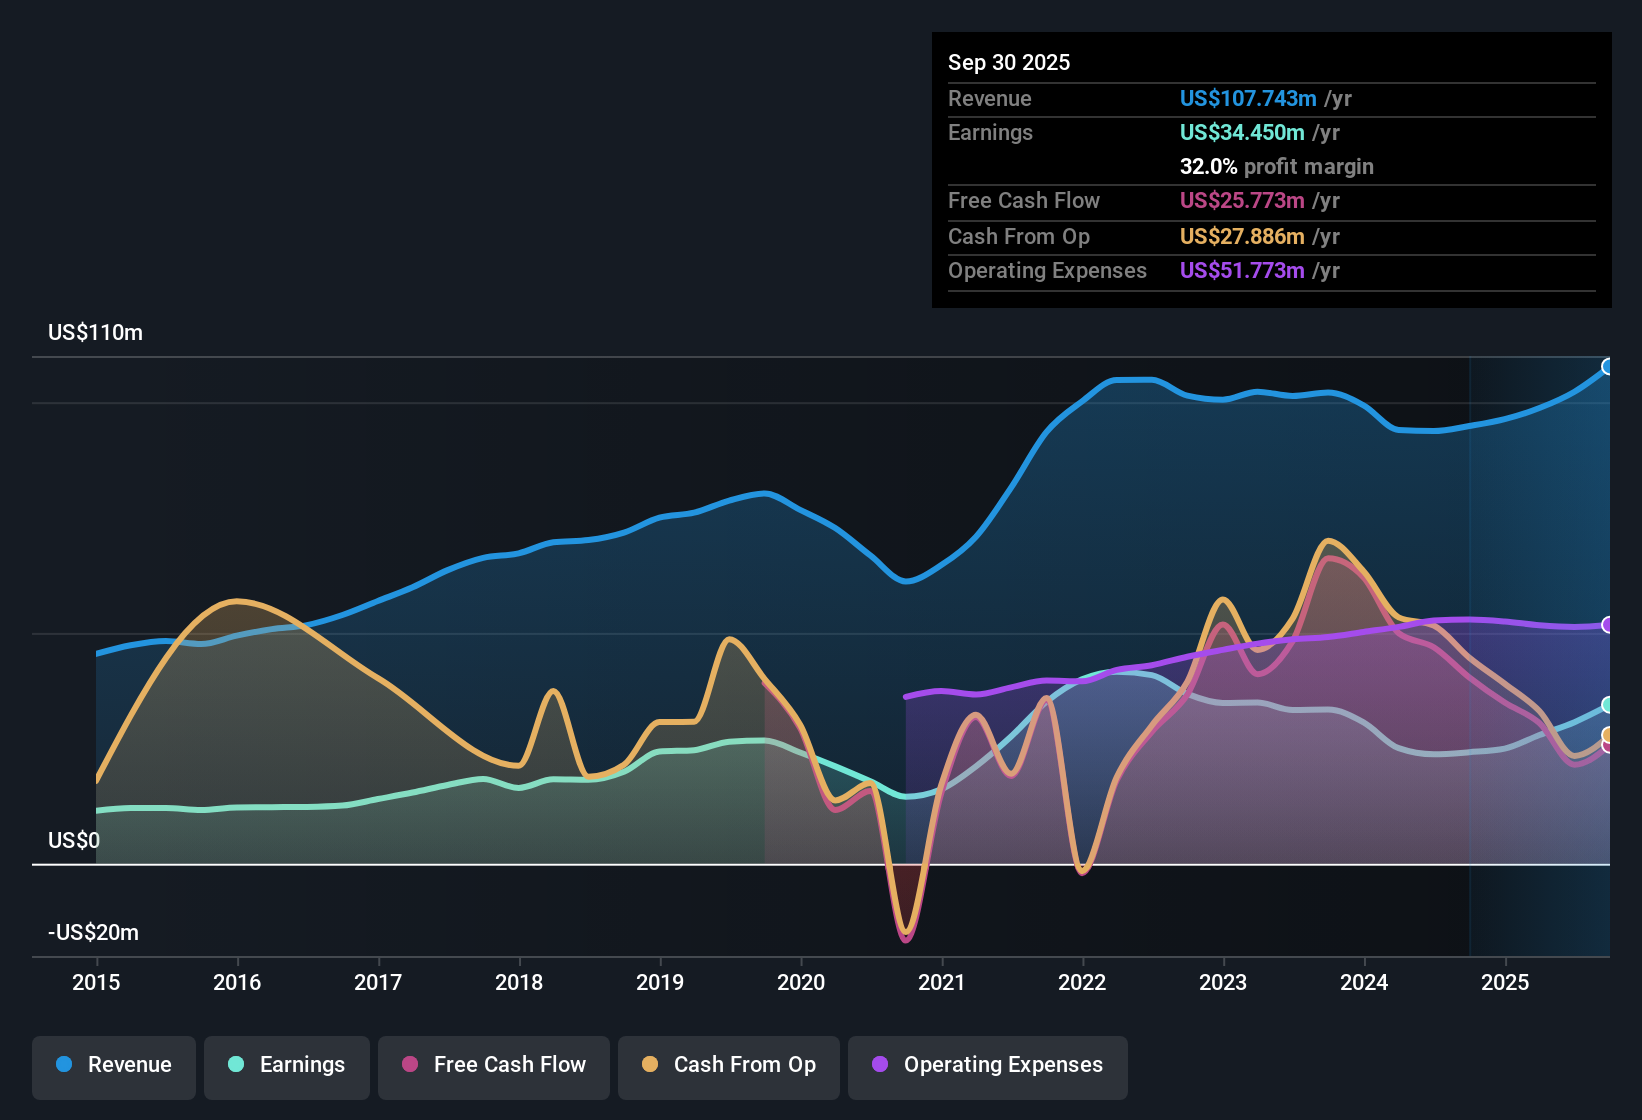
PCB Bancorp (PCB) reported a net profit margin of 30%, up from 25.3% the prior year, with earnings growing 29.4% year-over-year. This is well above its five-year average annual rate of 1.4%. The stock trades at a Price-to-Earnings Ratio of 9.9x, lower than both the peer average of 12.2x and the US Banks industry average of 11.2x. The share price of $21.48 is below an estimated fair value of $31.14 based on discounted cash flow analysis. With solid profitability, discounted market multiples, and clear growth drivers, these results may position PCB favorably in the eyes of value-focused investors.

See our full analysis for PCB Bancorp.

Now it's time to see how this performance lines up with the most widely discussed narratives. Let's compare the numbers to prevailing market views and spot any surprises.

NasdaqGS:PCB Earnings & Revenue History as at Oct 2025

Net Profit Margin Hits 30% High

  • PCB Bancorp’s net profit margin climbed to 30%, a notable increase from last year’s 25.3%, putting it near the top tier for community banks.
  • Strong profitability heavily supports the case for investor confidence. The prevailing view is that prudent financial management and conservative lending practices have helped sustain this margin even in a challenging sector.
    • The margin stands out as a sign of operational resilience, a key theme among regional peers.
    • Commentary highlights that the lack of negative press and steady margin growth may help PCB attract value-seeking investors focused on stability and predictability.

Growth Rate Far Outpaces Five-Year Average

  • Earnings for the past year grew by 29.4%, an eye-opener compared to the company’s modest 1.4% five-year average annual rate, showing a dramatic recent acceleration in profitability.
  • This surge challenges those who see regional banks as “unexciting.” The performance brings PCB into conversation with faster-growing industry players and suggests management may be executing above expectations.
    • The sizable jump versus the long-term average hints at underlying momentum not captured in more cautious sector narratives.
    • Even in a year where many banks struggled, PCB broke from historical patterns with a sharper upward climb.

Share Price Below DCF Fair Value

  • At $21.48, PCB’s share price is meaningfully below its DCF fair value of $31.14. Its Price-to-Earnings Ratio of 9.9x is also lower than both peers (12.2x) and the US Banks industry average (11.2x).
  • This gap creates a valuation tension that can catch the eye of value-focused investors, who may see the discounted price plus strong profit growth as a rare opportunity in the regional banking space.
    • Trading well under both peer and industry multiples, the stock’s current price point appears to heavily favor buyers looking for upside.
    • Risks are not apparent in the current filings, which further bolsters the appeal of a valuation story already supported by improving fundamentals.

Next Steps

Don't just look at this quarter; the real story is in the long-term trend. We've done an in-depth analysis on PCB Bancorp's growth and its valuation to see if today's price is a bargain. Add the company to your watchlist or portfolio now so you don't miss the next big move.

See What Else Is Out There

Despite PCB Bancorp’s impressive annual earnings surge, its longer-term growth history has trailed many high-performing peers. This highlights limited consistency over time.

If you want to find businesses delivering steady results year after year, target those with solid track records by using stable growth stocks screener (2099 results) to see which companies maintain reliable growth across any cycle.

This article by Simply Wall St is general in nature. We provide commentary based on historical data and analyst forecasts only using an unbiased methodology and our articles are not intended to be financial advice. It does not constitute a recommendation to buy or sell any stock, and does not take account of your objectives, or your financial situation. We aim to bring you long-term focused analysis driven by fundamental data. Note that our analysis may not factor in the latest price-sensitive company announcements or qualitative material. Simply Wall St has no position in any stocks mentioned.

Every question you ask will be answered
Scan the QR code to contact us
whatsapp
Also you can contact us via