
Please use a PC Browser to access Register-Tadawul
Get It
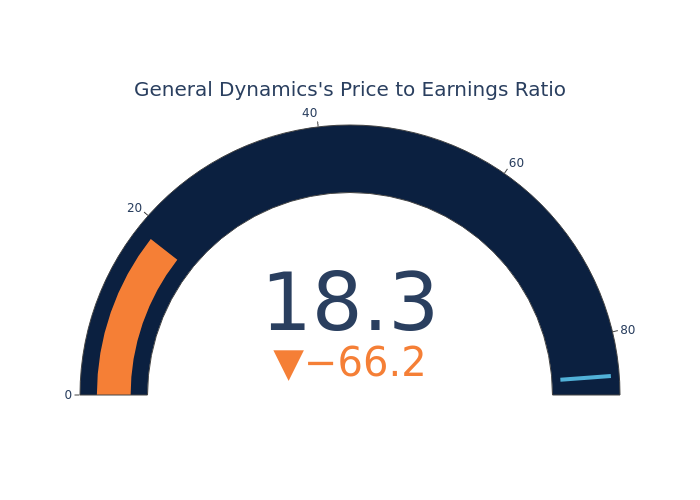
P/E Ratio Insights for General Dynamics
General Dynamics Corporation GD | 337.49 | -1.17% |
In the current session, General Dynamics Inc. (NYSE:GD) is trading at $244.85, after a 2.06% decrease. Over the past month, the stock fell by 7.29%, and in the past year, by 15.23%. With performance like this, long-term shareholders are more likely to start looking into the company's price-to-earnings ratio.

The P/E ratio is used by long-term shareholders to assess the company's market performance against aggregate market data, historical earnings, and the industry at large. A lower P/E could indicate that shareholders do not expect the stock to perform better in the future or it could mean that the company is undervalued.
General Dynamics has a lower P/E than the aggregate P/E of 84.47 of the Aerospace & Defense industry. Ideally, one might believe that the stock might perform worse than its peers, but it's also probable that the stock is undervalued.
In conclusion, the price-to-earnings ratio is a useful metric for analyzing a company's market performance, but it has its limitations. While a lower P/E can indicate that a company is undervalued, it can also suggest that shareholders do not expect future growth. Additionally, the P/E ratio should not be used in isolation, as other factors such as industry trends and business cycles can also impact a company's stock price. Therefore, investors should use the P/E ratio in conjunction with other financial metrics and qualitative analysis to make informed investment decisions.
