Please use a PC Browser to access Register-Tadawul
Performance Comparison: Ambev And Competitors In Beverages Industry
Ambev SA Sponsored ADR ABEV | 2.55 | -1.54% |
In today's rapidly evolving and fiercely competitive business landscape, it is crucial for investors and industry analysts to conduct comprehensive company evaluations. In this article, we will undertake an in-depth industry comparison, assessing Ambev (NYSE:ABEV) alongside its primary competitors in the Beverages industry. By meticulously examining crucial financial indicators, market positioning, and growth potential, we aim to provide valuable insights to investors and shed light on company's performance within the industry.
Ambev Background
Ambev is the largest brewer in Latin America and the Caribbean and is Anheuser-Busch InBev's subsidiary in the region. It produces, distributes, and sells beer and PepsiCo products in Brazil and other Latin American countries and owns Argentina's largest brewer, Quinsa. Ambev was formed in 1999 through the merger of Brazil's two largest beverage companies, Brahma and Antarctica. In 2004, Ambev combined with Canadian brewer Labatt, giving Interbrew (now AB InBev) a controlling interest of 61.8% as at the end of 2023.
| Company | P/E | P/B | P/S | ROE | EBITDA (in billions) | Gross Profit (in billions) | Revenue Growth |
|---|---|---|---|---|---|---|---|
| Ambev SA | 13.48 | 2.46 | 2.45 | 5.19% | $6.95 | $10.69 | -11.91% |
| Anheuser-Busch InBev SA/NV | 23.40 | 1.47 | 2.10 | 2.31% | $3.61 | $7.79 | -1.33% |
| Molson Coors Beverage Co | 15.41 | 1.08 | 1.25 | 0.78% | $0.42 | $1.03 | 6.13% |
| Boston Beer Co Inc | 49.59 | 3.44 | 1.88 | -1.65% | $-0.0 | $0.15 | -12.02% |
| United Breweries Co Inc | 20.30 | 1.76 | 0.84 | 3.25% | $41.32 | $264.27 | -16.61% |
| Average | 27.18 | 1.94 | 1.52 | 1.17% | $11.34 | $68.31 | -5.96% |
After a detailed analysis of Ambev, the following trends become apparent:
-
The Price to Earnings ratio of 13.48 is 0.5x lower than the industry average, indicating potential undervaluation for the stock.
-
It could be trading at a premium in relation to its book value, as indicated by its Price to Book ratio of 2.46 which exceeds the industry average by 1.27x.
-
The Price to Sales ratio of 2.45, which is 1.61x the industry average, suggests the stock could potentially be overvalued in relation to its sales performance compared to its peers.
-
The Return on Equity (ROE) of 5.19% is 4.02% above the industry average, highlighting efficient use of equity to generate profits.
-
With lower Earnings Before Interest, Taxes, Depreciation, and Amortization (EBITDA) of $6.95 Billion, which is 0.61x below the industry average, the company may face lower profitability or financial challenges.
-
With lower gross profit of $10.69 Billion, which indicates 0.16x below the industry average, the company may experience lower revenue after accounting for production costs.
-
The company's revenue growth of -11.91% is significantly lower compared to the industry average of -5.96%. This indicates a potential fall in the company's sales performance.
Debt To Equity Ratio

The debt-to-equity (D/E) ratio assesses the extent to which a company relies on borrowed funds compared to its equity.
Considering the debt-to-equity ratio in industry comparisons allows for a concise evaluation of a company's financial health and risk profile, aiding in informed decision-making.
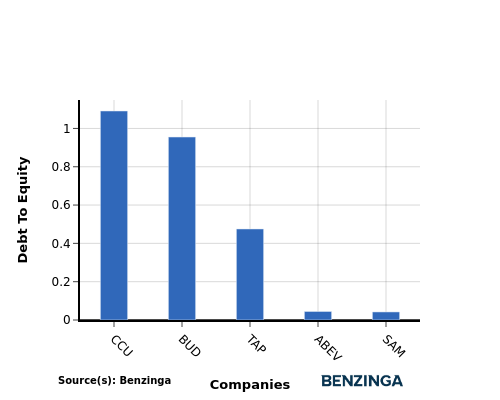
In terms of the Debt-to-Equity ratio, Ambev stands in comparison with its top 4 peers, leading to the following comparisons:
-
Compared to its top 4 peers, Ambev has a moderate debt-to-equity ratio of 0.04, indicating a balanced financial structure.
-
This suggests that the company maintains a reasonable level of debt while also leveraging equity financing.
Key Takeaways
For PE, PB, and PS ratios, Ambev shows a low PE ratio, indicating potential undervaluation compared to peers. However, its high PB and PS ratios suggest overvaluation relative to industry standards. In terms of ROE, EBITDA, gross profit, and revenue growth, Ambev demonstrates high ROE but low EBITDA, gross profit, and revenue growth compared to industry peers, indicating mixed performance in operational efficiency and growth potential within the Beverages industry.
This article was generated by Benzinga's automated content engine and reviewed by an editor.


