
Please use a PC Browser to access Register-Tadawul
Get It
Rapid Store Expansion And Steady Sales At Ollie’s Might Change The Case For Investing In OLLI
Ollie's Bargain Outlet Holdings Inc OLLI | 108.71 | -0.72% |
The end of cancer? These 29 emerging AI stocks are developing tech that will allow early identification of life changing diseases like cancer and Alzheimer's.
To own Ollie’s, you really have to believe its closeout-focused, treasure-hunt model can keep attracting traffic as the store base moves well beyond 600 locations. The recent update confirming 645 stores, 11.5% average annual unit growth and 3.2% same-store sales growth reinforces the near-term catalyst around scale: if new stores continue to open and ramp efficiently, that supports the company’s raised 2025 guidance and recent profit growth. At the same time, the share price has slipped over the past quarter, which suggests the market is still wrestling with execution risk and a valuation that screens expensive on earnings multiples despite a pullback. The biggest swing factors now are whether Ollie’s can keep finding attractive sites, protect margins and avoid overextending its concept as it grows.
However, rapid expansion can quietly magnify real estate, inventory and execution risks that investors should understand. Ollie's Bargain Outlet Holdings' share price has been on the slide but might be up to 40% below fair value. Find out if it's a bargain.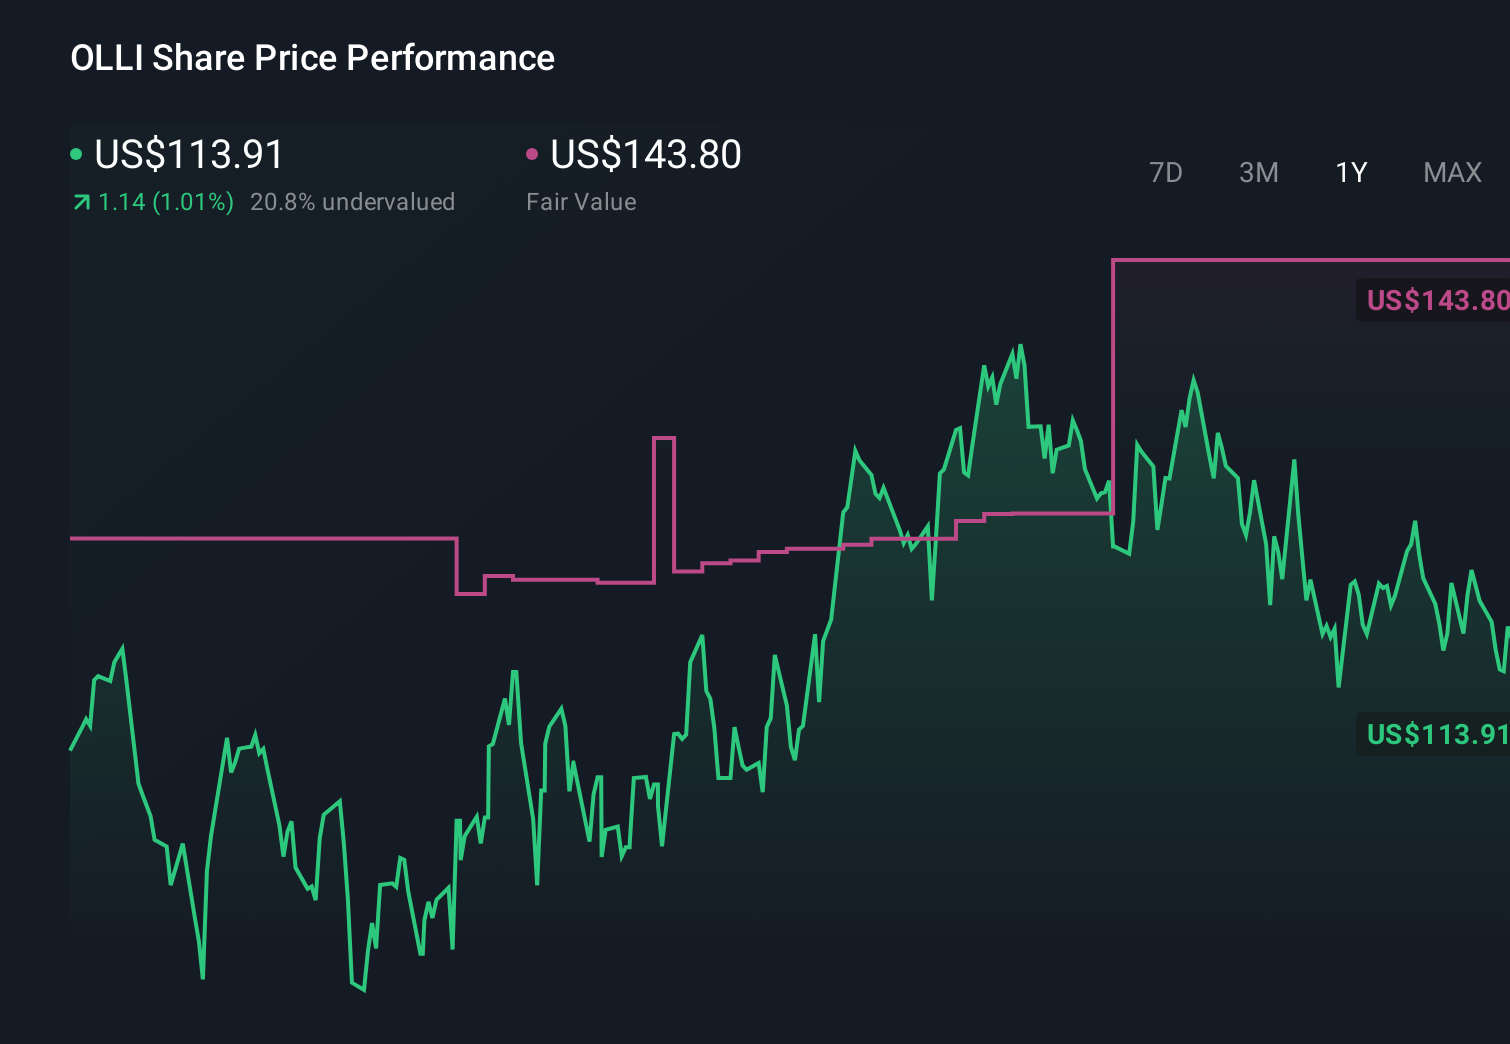
Explore 4 other fair value estimates on Ollie's Bargain Outlet Holdings - why the stock might be a potential multi-bagger!
Disagree with this assessment? Create your own narrative in under 3 minutes - extraordinary investment returns rarely come from following the herd.
Markets shift fast. These stocks won't stay hidden for long. Get the list while it matters:
This article by Simply Wall St is general in nature. We provide commentary based on historical data and analyst forecasts only using an unbiased methodology and our articles are not intended to be financial advice. It does not constitute a recommendation to buy or sell any stock, and does not take account of your objectives, or your financial situation. We aim to bring you long-term focused analysis driven by fundamental data. Note that our analysis may not factor in the latest price-sensitive company announcements or qualitative material. Simply Wall St has no position in any stocks mentioned.
