RBC Bearings (RBC) just posted its Q3 2026 numbers, reporting revenue of US$461.6 million and basic EPS of US$2.14. This is set against trailing 12-month EPS of US$8.55 and net income of US$268.6 million, which reflects earnings growth of 23.9% over the past year. The company’s quarterly revenue has moved from US$394.4 million in Q3 2025 to US$461.6 million in Q3 2026, while basic EPS over that span increased from US$1.83 to US$2.14. These results may be of interest to investors who are watching how a 15% trailing net margin shapes the discussion around earnings quality and sustainability.
See our full analysis for RBC Bearings.
With the latest figures now available, the next step is to compare this earnings profile with the most common narratives around RBC Bearings and to see where the numbers may challenge those views.
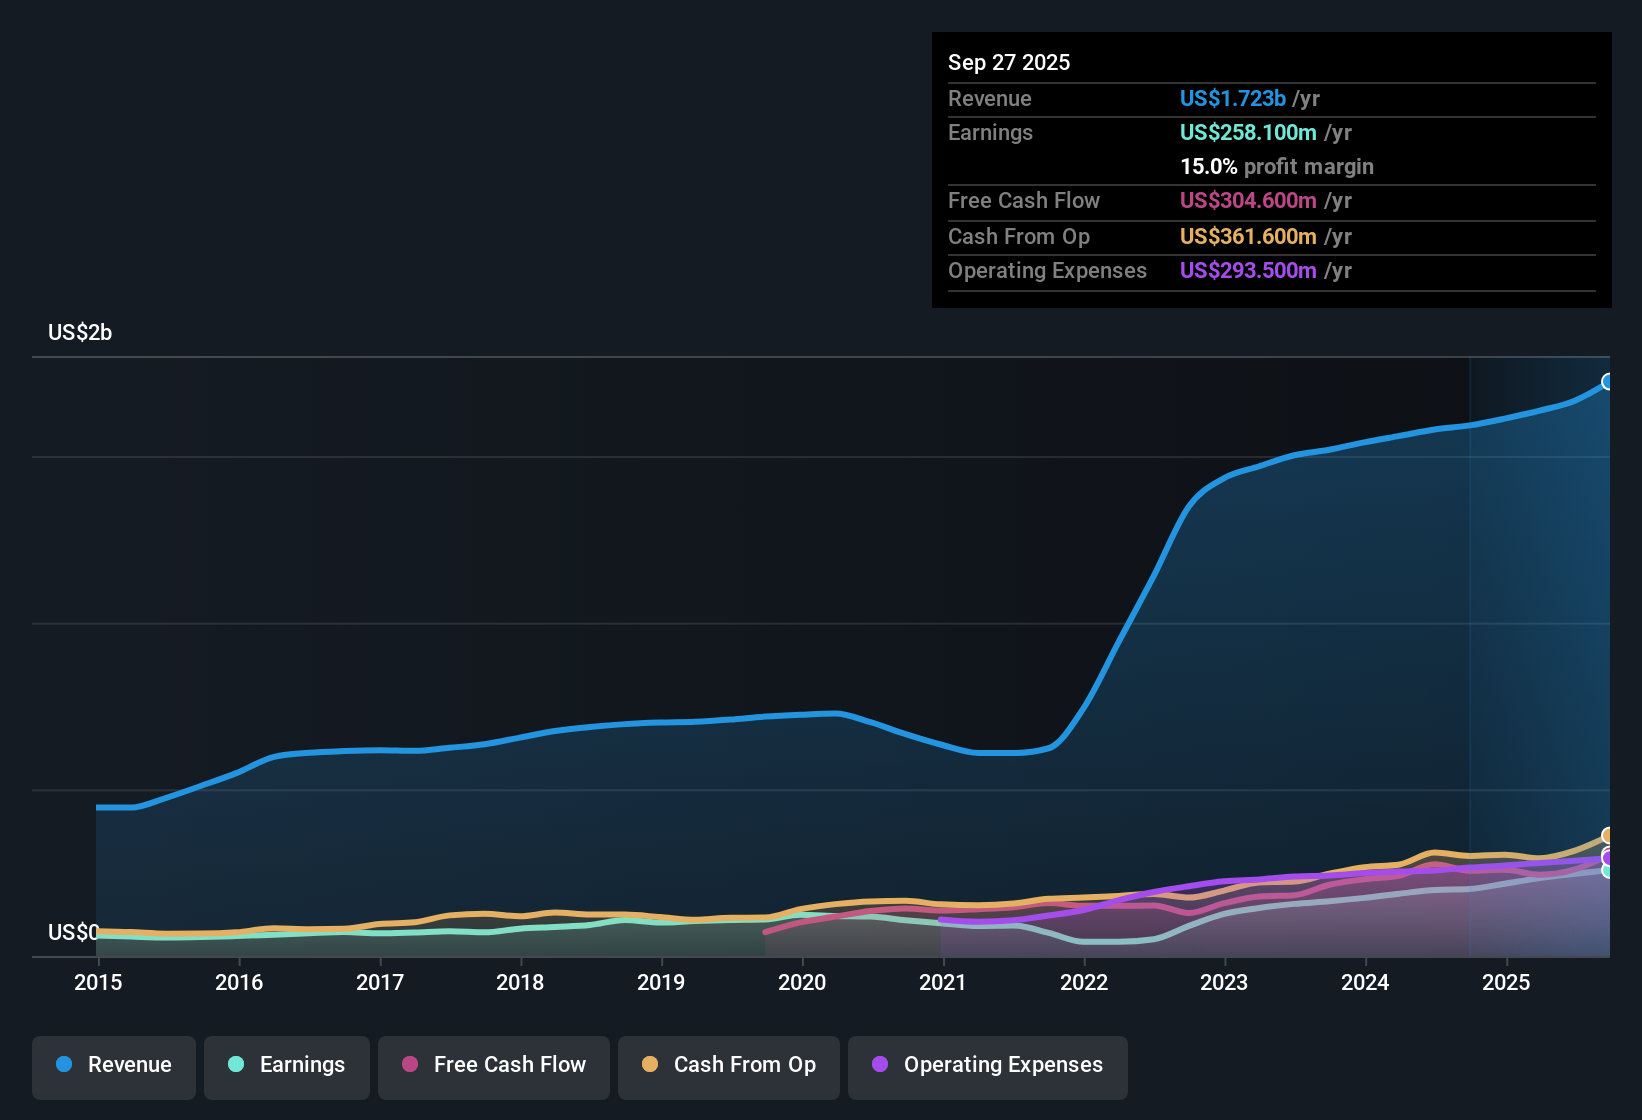
NYSE:RBC Earnings & Revenue History as at Feb 2026
23.9% earnings growth backed by higher margins
Over the last 12 months, net income reached US$268.6 million on US$1.79b of revenue, with earnings up 23.9% and the net margin at 15% compared with 13.4% a year earlier.
What stands out for the bullish view that RBC is an earnings driven story is that the 23.9% earnings growth over the year sits alongside a higher trailing margin of 15%. This comes on top of five year earnings growth that averaged 29.3% a year, which together point to profit growth being supported by both scale and profitability rather than just one off swings.
The bullish angle that earnings quality is high lines up with the data showing US$268.6 million of trailing net income on US$1.79b of revenue, not just a single strong quarter.
At the same time, the fact that the latest one year growth rate of 23.9% is below the 29.3% five year pace gives bulls a reason to watch whether the margin at 15% can keep offsetting any slowdown in growth rates.
Revenue climbs to US$461.6 million
Quarterly revenue has stepped from US$394.4 million in Q3 2025 to US$461.6 million in Q3 2026, and the trailing 12 month revenue has moved from US$1.59b in Q2 2025 to US$1.79b in Q3 2026.
For investors who lean bullish, the idea that RBC benefits from broad industrial and aerospace demand is supported by this move in quarterly revenue from US$394.4 million to US$461.6 million and the trailing revenue increase to US$1.79b. However, the earnings path shows some quarter to quarter noise, with net income over the last four reported quarters ranging between US$60 million and US$72.7 million.
Supporters of the bullish case may point out that Q3 2026 net income of US$67.4 million is above Q3 2025’s US$56.9 million, which aligns with the 23.9% earnings growth figure over the year.
On the other hand, the fact that quarterly net income has moved between US$48.5 million and US$72.7 million since Q2 2025 shows that even with a stronger trailing picture, the short term pattern is not a straight line.
Curious how these revenue and profit trends stack up over a longer horizon and what different investors are focusing on in the story right now? 📊 Read the full RBC Bearings Consensus Narrative.
Rich 64x P/E versus peers
The shares are quoted at US$544.02, which equates to a trailing P/E of 64x on the reported US$8.55 of EPS, compared with 27.9x for the US Machinery industry and 33.5x for the peer average, while the DCF fair value is listed at US$368.36.
Critics who focus on valuation risk point to the current price of US$544.02 sitting above the DCF fair value of US$368.36 and a 64x P/E that is well ahead of both the 27.9x industry level and the 33.5x peer average. Even though earnings have grown 23.9% over the past year and are forecast in the dataset to grow around 21.5% a year with revenue near 10.8% a year, the numbers make it clear that the market is already assigning a premium multiple to that growth profile.
The tension for bearish arguments is that margins at 15% and five year earnings growth of 29.3% a year offer concrete support for the idea that profitability has been strong, even as they question whether a 64x P/E is justified.
At the same time, bears can point to the gap between the share price of US$544.02 and the DCF fair value of US$368.36 as a simple yardstick suggesting that growth expectations are already embedded in the stock.
Next Steps
Don't just look at this quarter; the real story is in the long-term trend. We've done an in-depth analysis on RBC Bearings's growth and its valuation to see if today's price is a bargain. Add the company to your watchlist or portfolio now so you don't miss the next big move.
See What Else Is Out There
RBC Bearings pairs its earnings with a 64x P/E and a share price above its DCF fair value of US$368.36, which may concern valuation focused investors.
If that premium price tag makes you uneasy, you can quickly size up other ideas that look more reasonable on our 53 high quality undervalued stocks and see which ones merit a closer look today.
This article by Simply Wall St is general in nature. We provide commentary based on historical data and analyst forecasts only using an unbiased methodology and our articles are not intended to be financial advice. It does not constitute a recommendation to buy or sell any stock, and does not take account of your objectives, or your financial situation. We aim to bring you long-term focused analysis driven by fundamental data. Note that our analysis may not factor in the latest price-sensitive company announcements or qualitative material. Simply Wall St has no position in any stocks mentioned.