Please use a PC Browser to access Register-Tadawul
Get It
Rebound? Technical Indicators Show US Stocks Still Struggling
S&P 500 index SPX | 6829.10 | +0.02% |
NASDAQ IXIC | 23154.63 | -0.17% |
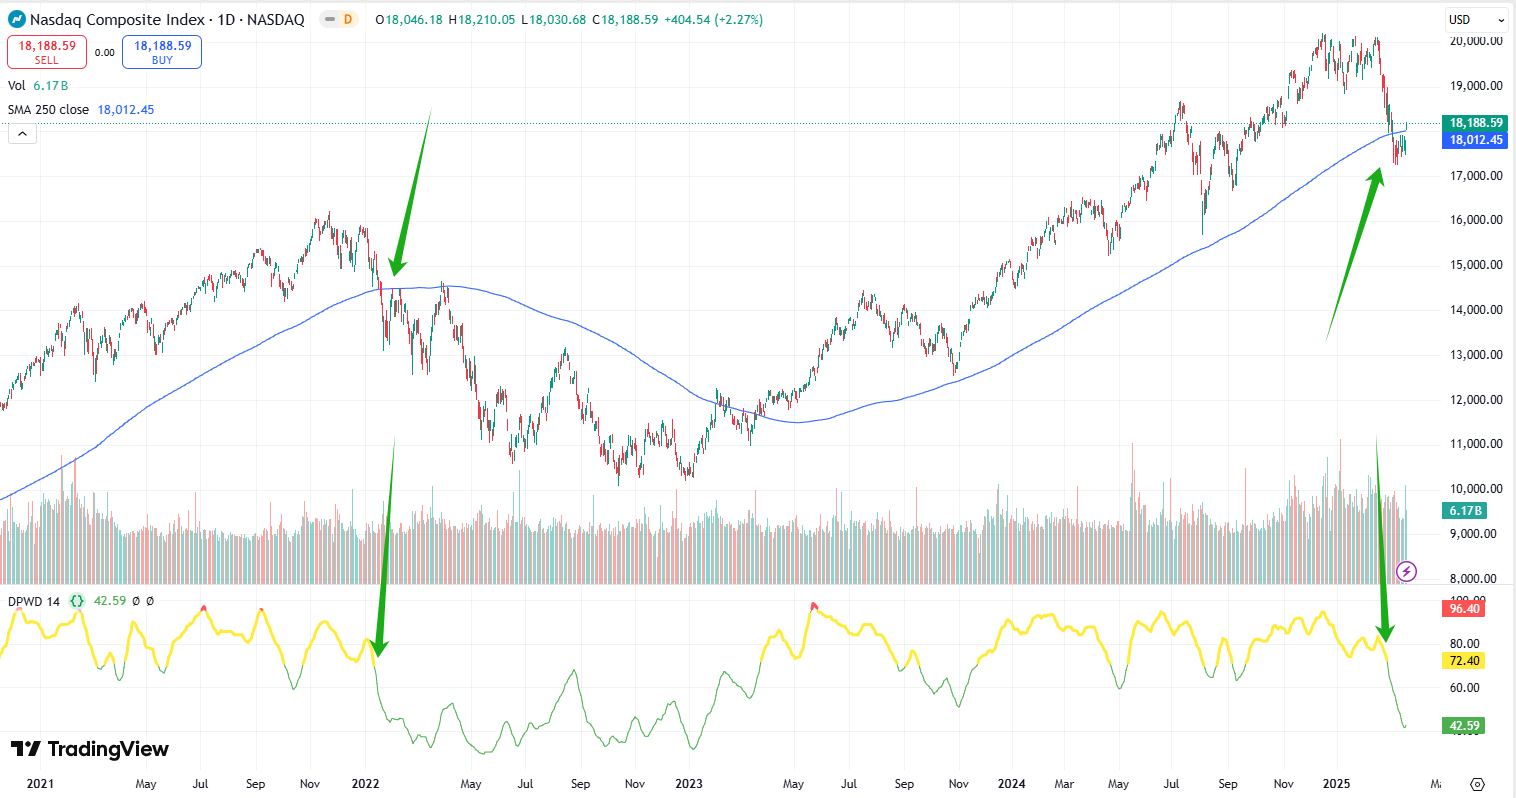
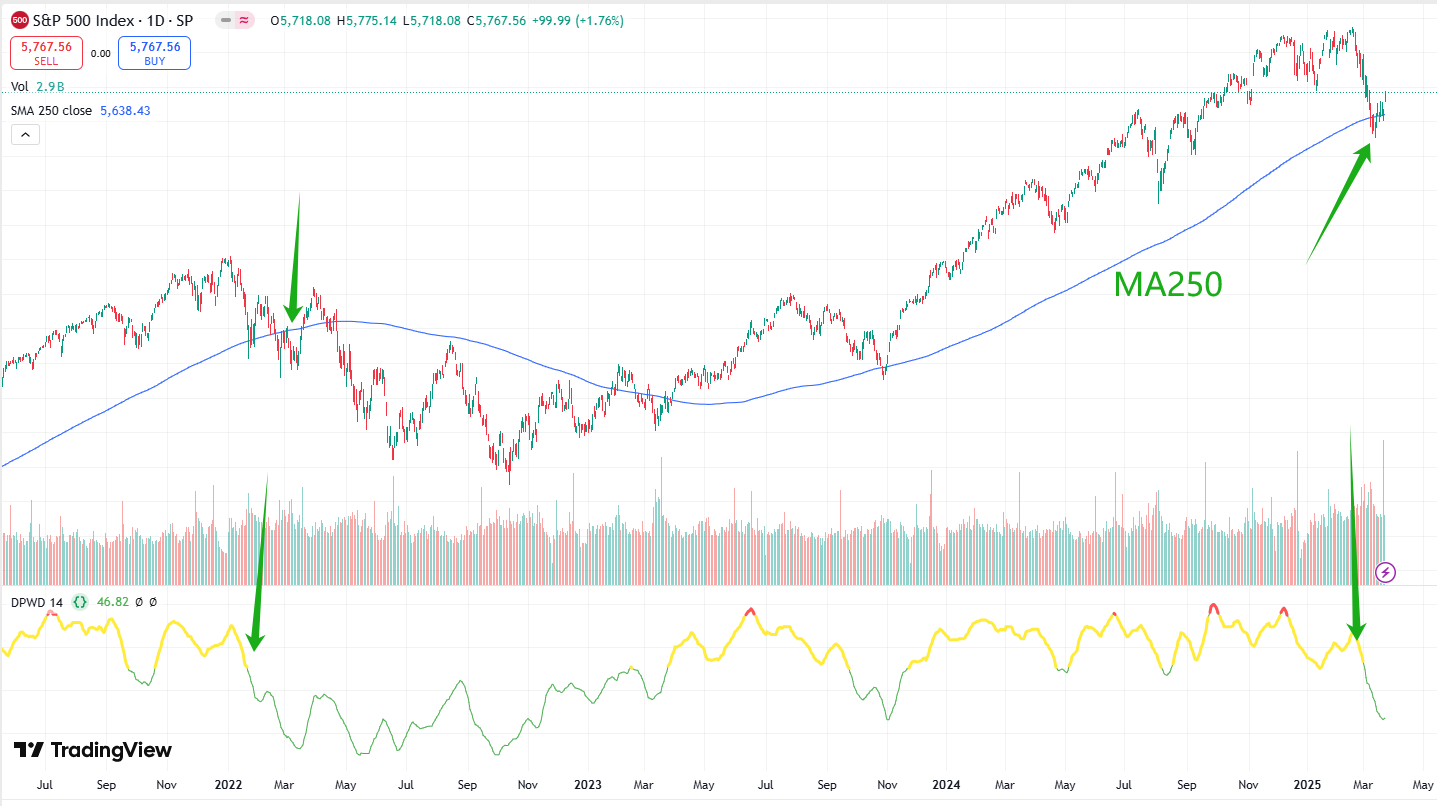
Well well well, look who's back at their favorite playground - the MA250 support level! Both the S&P 500 INDEX(SPX.US) and NASDAQ(IXIC.US) are currently testing this critical line like reckless teenagers daring each other to jump off a cliff.
📉 Last time they pulled this stunt:
Nasdaq took the plunge in early 2022 and kept falling like Wile E. Coyote running off a cliff
S&P 500? That drama queen failed the MA250 test twice - early 2022 and October 2023. The October dip was particularly shameless - it barely touched the support before bouncing back up like nothing happened. Talk about commitment issues!
🌡️ Meanwhile, their "vital signs" look... concerning
Our proprietary Index Thermometer (blending moving averages, MACD, RSI etc.) shows both indexes have been running a 15-day "low-grade fever" (score <70) with no signs of returning to the "healthy zone" (>70) soon. The last time they looked this pale was during October 2023's 40-day chill. Before that? The brutal 18-month bear market after early 2022's breakdown. Yikes.
💰 Valuation? Still priced like luxury goods
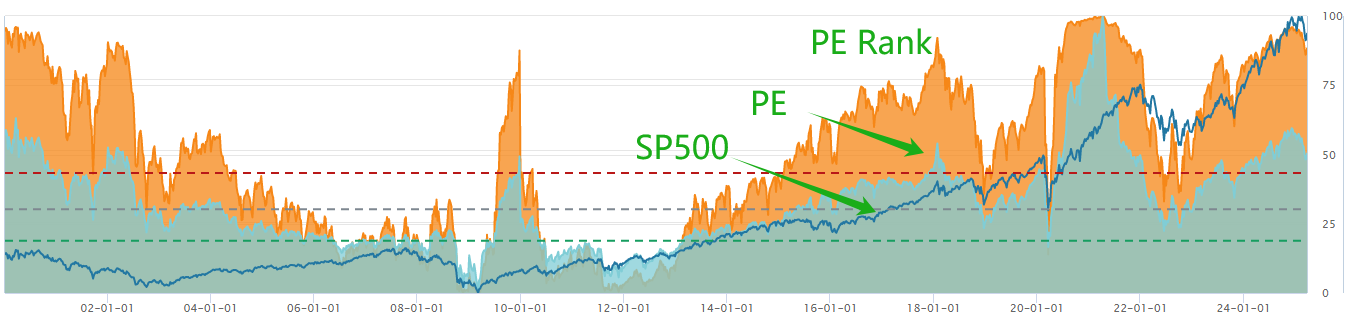
S&P 500's P/E (26x) is more expensive than 88% of history since 2000
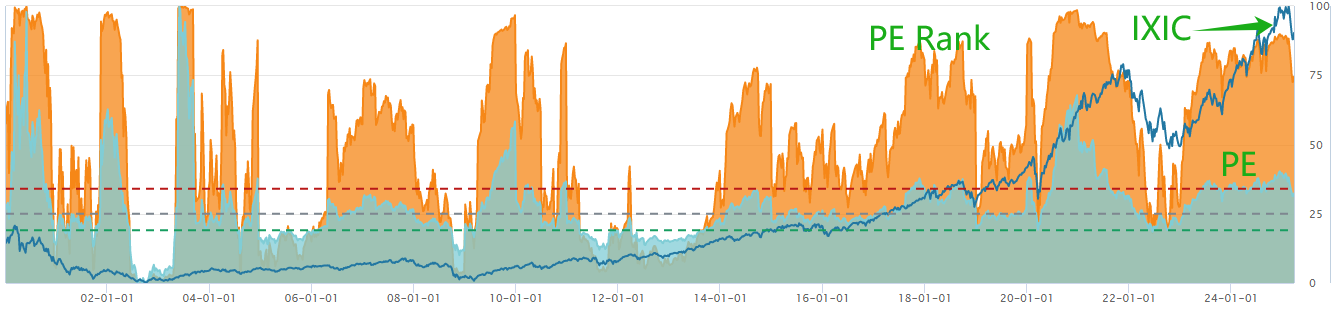
Nasdaq's 40x P/E still sits at the 75th percentile
(But hey, maybe this time is different? Said every investor before a crash.)
🤔 So the million-dollar question:
Has the market finally found its footing? Or is MA250 just a temporary trampoline before the real plunge? Place your bets in the comments!